Fig. 6
Download original image
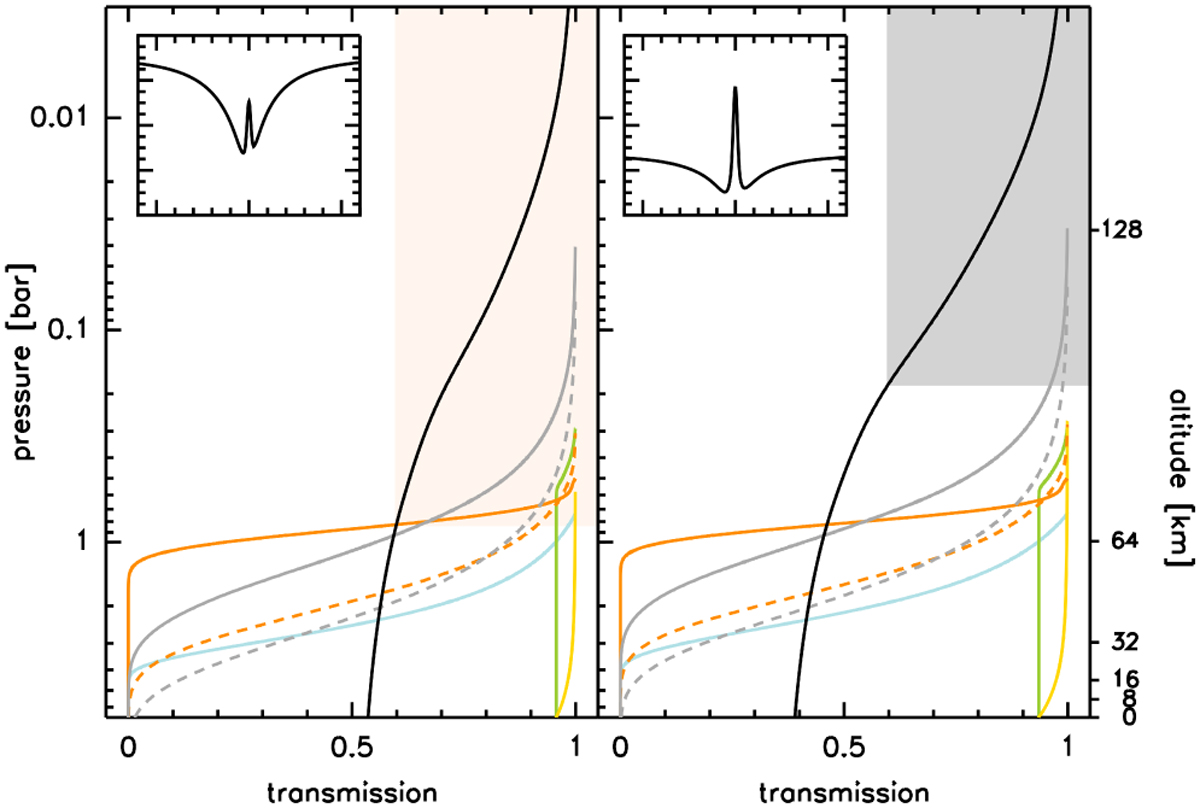
Profiles of the transmission in the HD, J = 1–0 line for sight-lines originating at the sub-observer point (left) and shifted along the equator to a projected distance of 0.75 Jupiter radii (![]() ),
), ![]() from the planet’s limb (right). The inserts show synthesized spectra for these sightlines at the same scales of (−60, +60) km s−1 and (1.4, 2.2) kJy/beam. For demonstration purposes, the spatial resolution was increased (2″ half-power width, for Nyquist-critical 1″ sampling steps) and the planet’s rotation omitted. The abscissa represents the sightline transmission
from the planet’s limb (right). The inserts show synthesized spectra for these sightlines at the same scales of (−60, +60) km s−1 and (1.4, 2.2) kJy/beam. For demonstration purposes, the spatial resolution was increased (2″ half-power width, for Nyquist-critical 1″ sampling steps) and the planet’s rotation omitted. The abscissa represents the sightline transmission ![]() from a pressure altitude p0 (left ordinate, the right ordinate shows the corresponding altitude above a 6.7 bar base level) to pout toward the observer, related to the absorption coefficient κ by equation (5), with contributions from HD, J = 1–0 (black, at line center), collision-induced absorption (due to H2−H2 collisions, solid gray, and H2−He collisions, dashed gray), bright-blue (water ice), green (ammonia ice), CH4 (yellow), NH3 (orange), and PH3 (dashed orange). The color assignment is identical to that in Fig. 2. The crossings of each curve with the lower abscissa indicate the transmission from the base to the top level of the model atmospheres for the given solid or gaseous species. The area where the transmission along the sub-observer sight-line is limited by self-absorption in HD (
from a pressure altitude p0 (left ordinate, the right ordinate shows the corresponding altitude above a 6.7 bar base level) to pout toward the observer, related to the absorption coefficient κ by equation (5), with contributions from HD, J = 1–0 (black, at line center), collision-induced absorption (due to H2−H2 collisions, solid gray, and H2−He collisions, dashed gray), bright-blue (water ice), green (ammonia ice), CH4 (yellow), NH3 (orange), and PH3 (dashed orange). The color assignment is identical to that in Fig. 2. The crossings of each curve with the lower abscissa indicate the transmission from the base to the top level of the model atmospheres for the given solid or gaseous species. The area where the transmission along the sub-observer sight-line is limited by self-absorption in HD (![]() self), rather than by the NH3 opacity, is highlighted in beige (left). For the off-center sightline, the gray area indicates the pressure range for which the transmission falls above
self), rather than by the NH3 opacity, is highlighted in beige (left). For the off-center sightline, the gray area indicates the pressure range for which the transmission falls above ![]() self (right).
self (right).
Current usage metrics show cumulative count of Article Views (full-text article views including HTML views, PDF and ePub downloads, according to the available data) and Abstracts Views on Vision4Press platform.
Data correspond to usage on the plateform after 2015. The current usage metrics is available 48-96 hours after online publication and is updated daily on week days.
Initial download of the metrics may take a while.