Fig. 5
Download original image
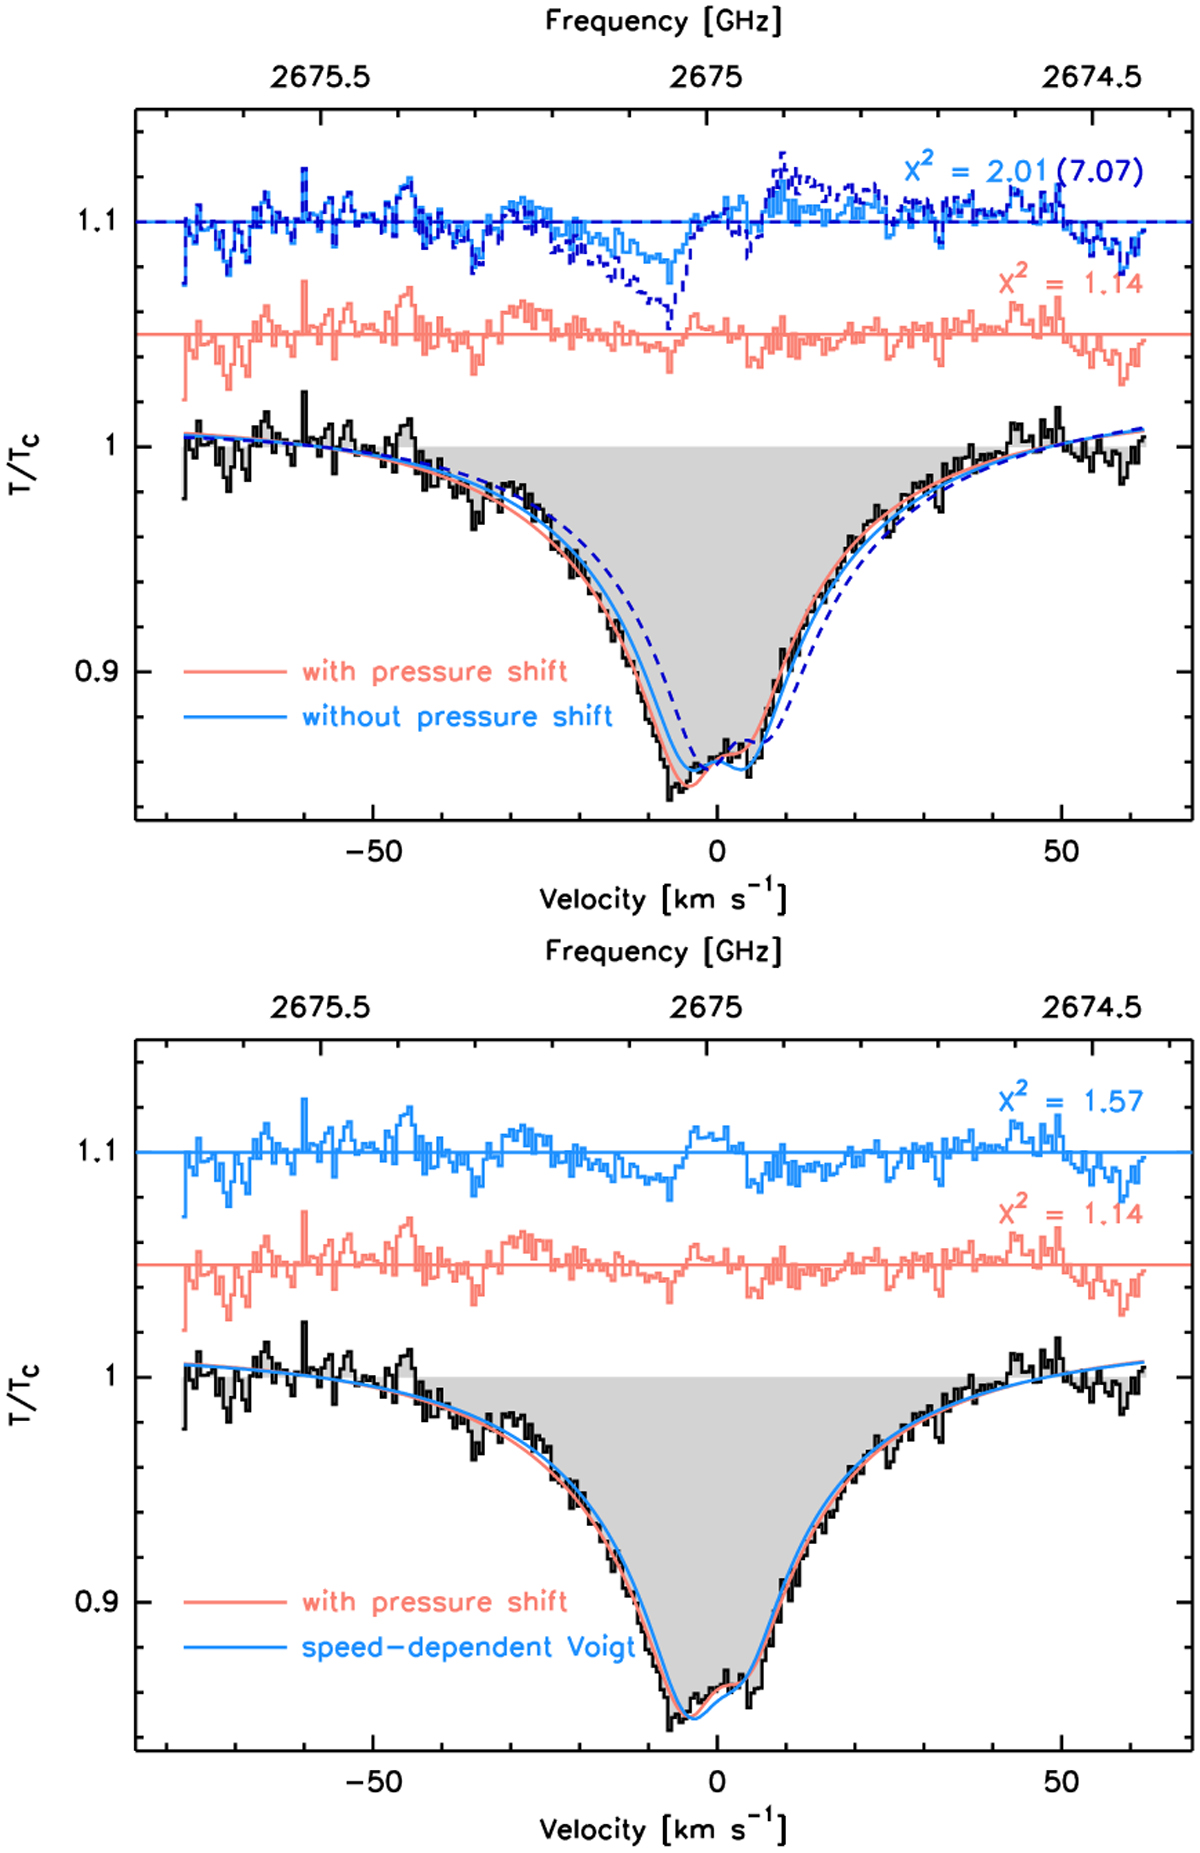
HD (J = 1–0) spectrum toward Jupiter’s center, with best-fit models overlaid. The velocity scale refers to the Jovian system baryceter. Top: HD (J = 1–0) (black line and gray-filled histogram) and modeled Voigt profiles with pressure shift (red) and without (blue, the dashed profile is for a ![]() pointing offset). Residuals and their normalized χ2 values (in brackets for the offset pointing) are shown atop (in corresponding colors, with ordinate shifts for clarity). Note the less-suppressed bandpass ripples located on the wings of the absorption profile, as discussed in section 3. Bottom: as above, but comparing the speed-dependent with the pressure-shifted Voigt profile (blue, respectively red).
pointing offset). Residuals and their normalized χ2 values (in brackets for the offset pointing) are shown atop (in corresponding colors, with ordinate shifts for clarity). Note the less-suppressed bandpass ripples located on the wings of the absorption profile, as discussed in section 3. Bottom: as above, but comparing the speed-dependent with the pressure-shifted Voigt profile (blue, respectively red).
Current usage metrics show cumulative count of Article Views (full-text article views including HTML views, PDF and ePub downloads, according to the available data) and Abstracts Views on Vision4Press platform.
Data correspond to usage on the plateform after 2015. The current usage metrics is available 48-96 hours after online publication and is updated daily on week days.
Initial download of the metrics may take a while.