Fig. 2
Download original image
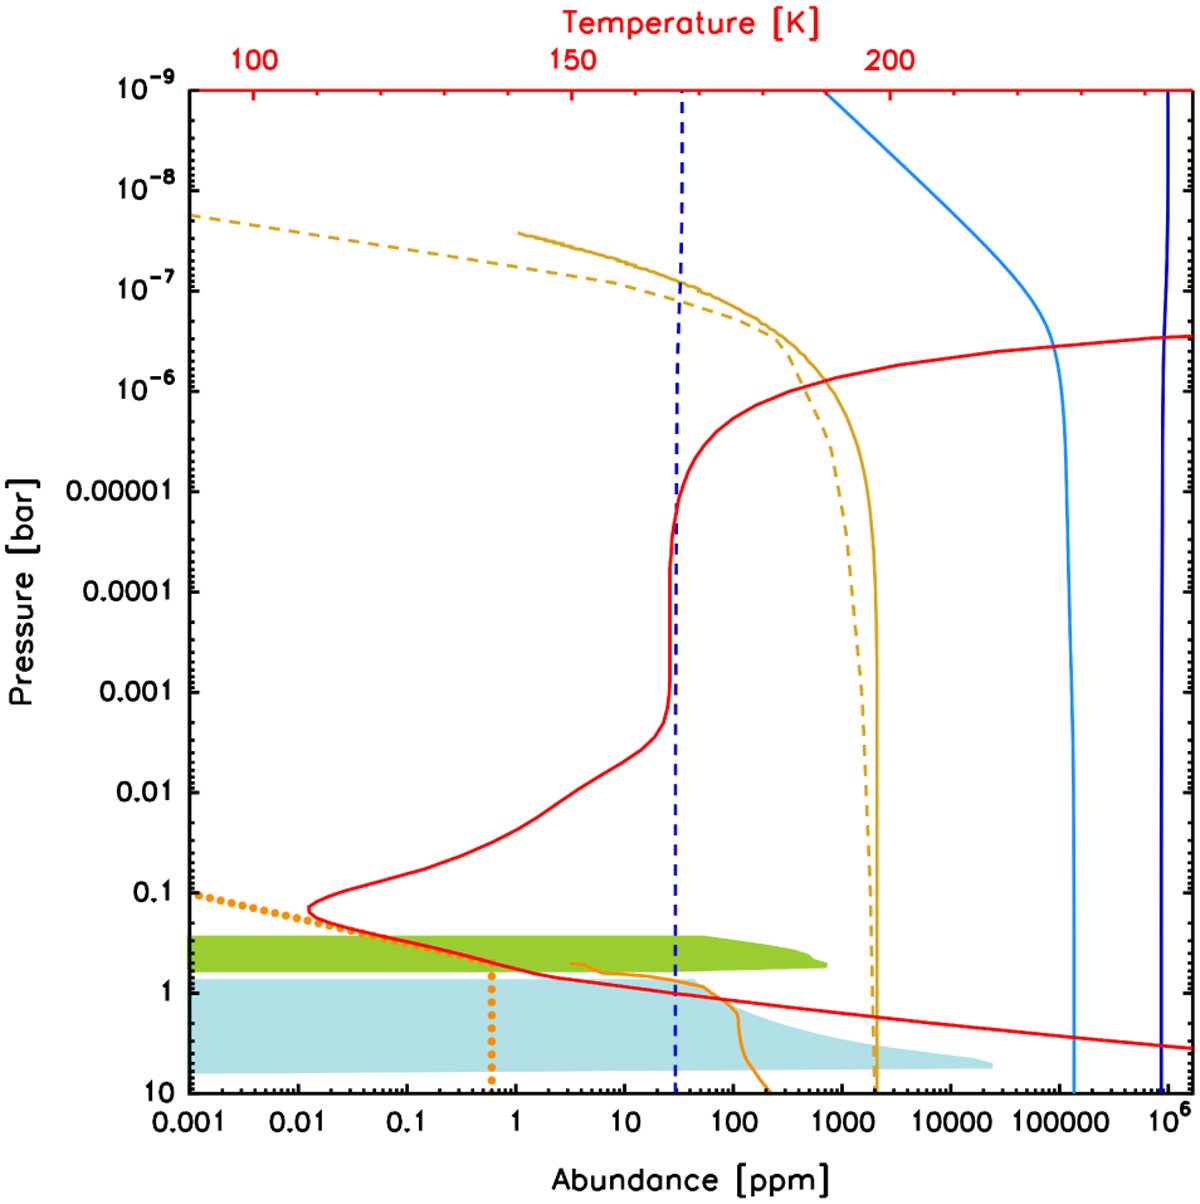
Vertical temperature (red) and abundance profiles against pressure altitude (ordinate), as used in the best-fit model. Abscissae (all in ppm, indicating mass fractions for ices, and volume-mixing ratios for gaseous species) are as follows: ammonia ice (green), water ice (bright blue), H2 and HD (dark blue, solid respectively dashed profile), He (medium blue), CH4 (yellow solid line, Sánchez-López et al. 2022), NH3 (orange, solid line), PH3 (orange, dotted line). The dashed yellow CH4-profile is the original abundance layering from Moses et al. (2005). For further references see Table 1.
Current usage metrics show cumulative count of Article Views (full-text article views including HTML views, PDF and ePub downloads, according to the available data) and Abstracts Views on Vision4Press platform.
Data correspond to usage on the plateform after 2015. The current usage metrics is available 48-96 hours after online publication and is updated daily on week days.
Initial download of the metrics may take a while.