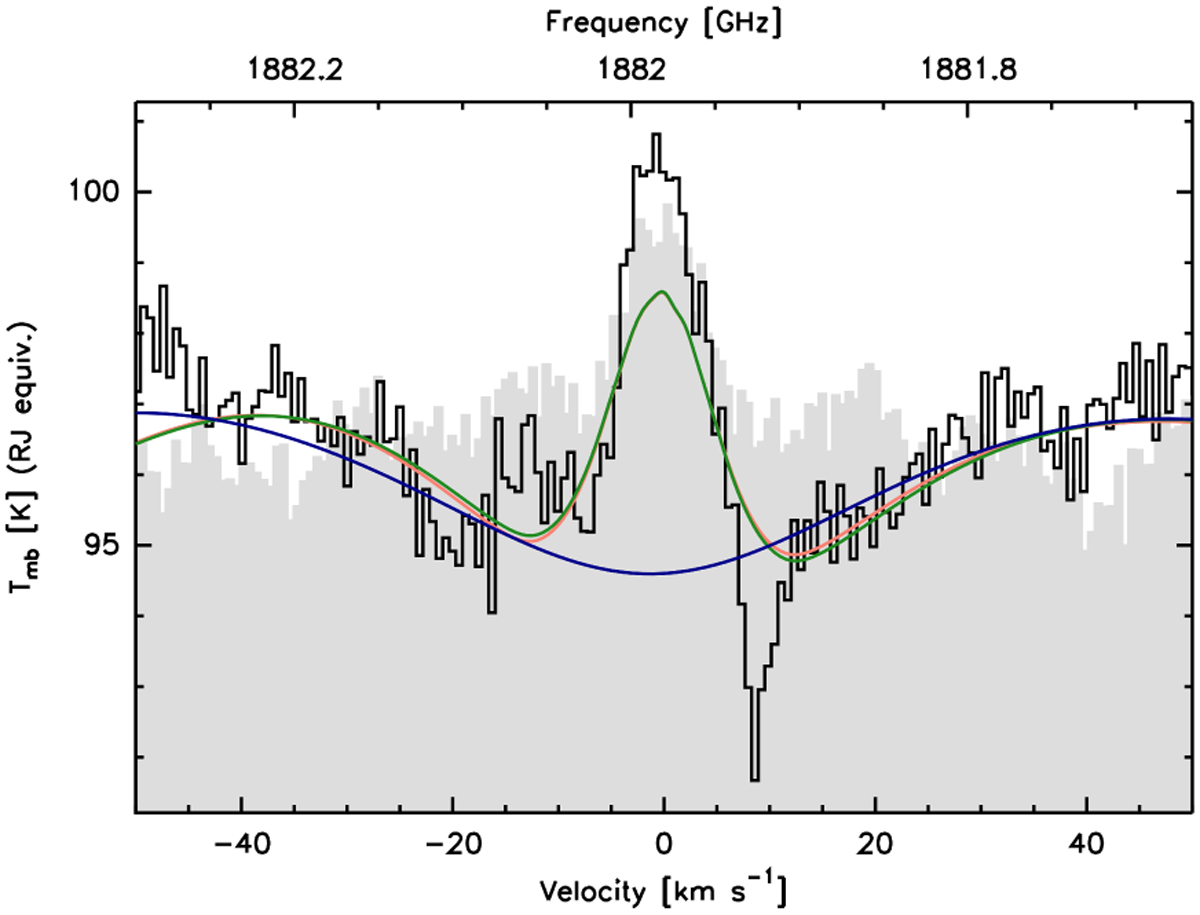
Fig. B.1
Download original image
CH4 (J = 6 − 5) spectrum toward Jupiter’s center from upGreat (black line) and HIFI (gray-shaded). The velocity scale refers to the Jovian system barycenter. The continuous lines refer to the synthetic spectra (with and without pressure-shift, in orange, respectively green). The dark-blue line profile is for a sightline bounded by the tropopause (p = 145 mbar in this model) and does not show the stratospheric contribution.
Current usage metrics show cumulative count of Article Views (full-text article views including HTML views, PDF and ePub downloads, according to the available data) and Abstracts Views on Vision4Press platform.
Data correspond to usage on the plateform after 2015. The current usage metrics is available 48-96 hours after online publication and is updated daily on week days.
Initial download of the metrics may take a while.