Fig. 4
Download original image
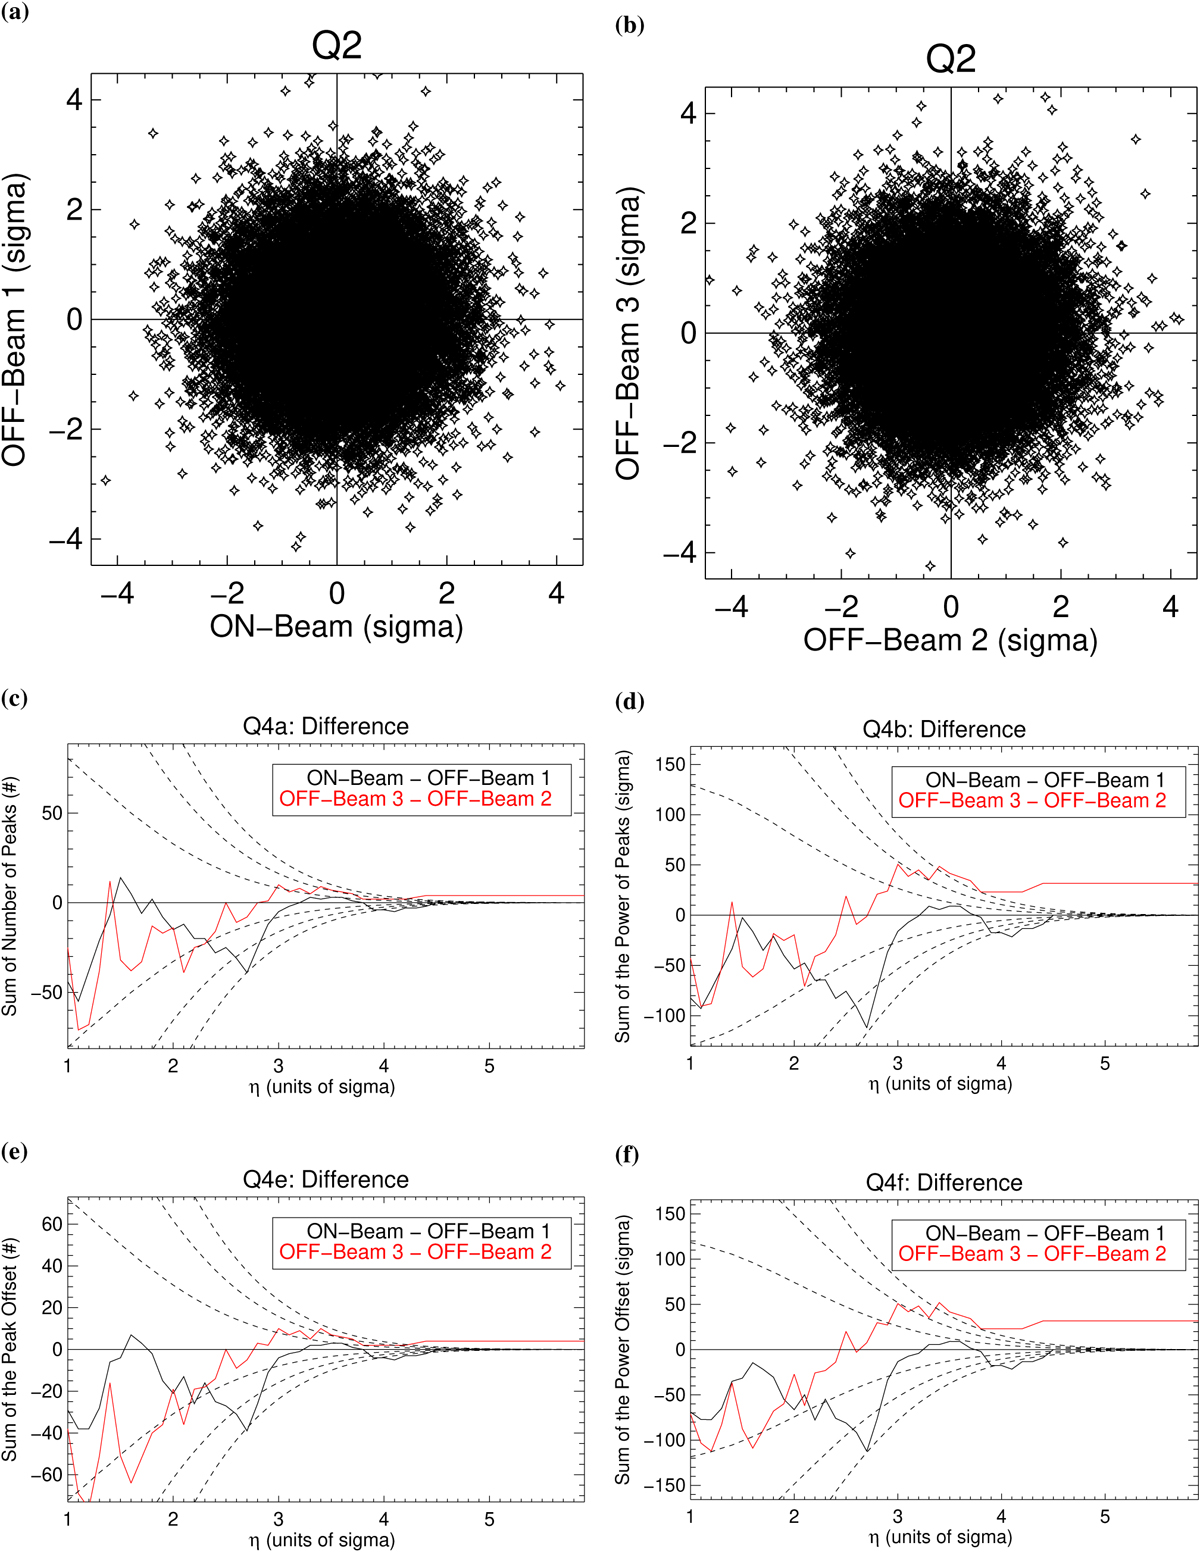
Non-detection of burst emission for τ Boo in the L776035 (2020-04-15) observation between 15 and 27 MHz in Stokes-V (|V′|). Panel a: Q2 for the ON-beam vs. the OFF-beam 2. Panel b: Q2 for the OFF-beam 1 vs. the OFF-beam 2. Panel c: Q4a (number of peaks). Panel d: Q4b (power of peaks). Panel e: Q4e (peak offset). Panel f: Q4f (peak offset). For panels c–f: the black lines are the ON-beam difference with the OFF beam 1 and the red lines are the OFF-beam difference. The dashed lines are statistical limits (1, 2, 3σ) of the difference between all the Q4 values derived using two different Gaussian distributions (each performed 10 000 times). We do not see any excess signal in the ON-beam compared to the OFF-beams. In fact, the OFF-beams show a false-positive weak signal at η ~ 4.
Current usage metrics show cumulative count of Article Views (full-text article views including HTML views, PDF and ePub downloads, according to the available data) and Abstracts Views on Vision4Press platform.
Data correspond to usage on the plateform after 2015. The current usage metrics is available 48-96 hours after online publication and is updated daily on week days.
Initial download of the metrics may take a while.