Fig. 7.
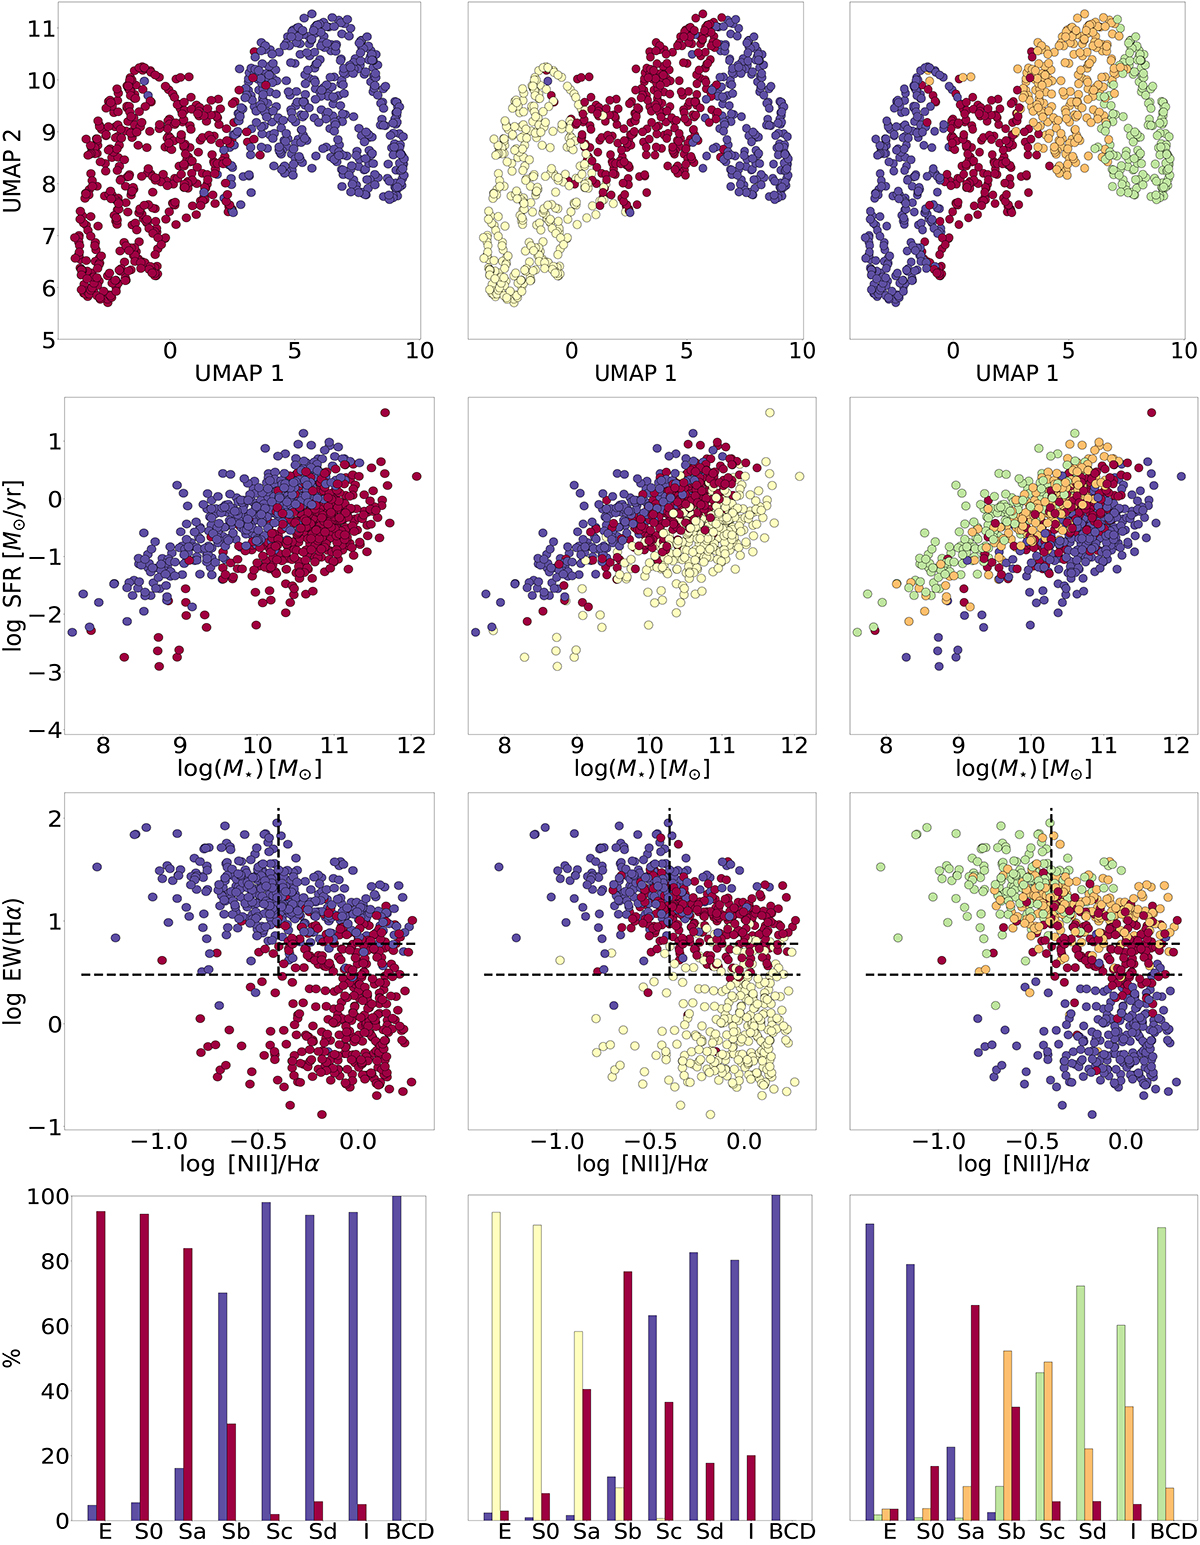
Download original image
Visualisation of galaxy clustering and properties from the eCALIFA sample. Each column in the figure represents a different number of clusters, with the number increasing from two to four as we move from left to right. The rows are organised as follows. The first row presents the UMAP projection of galaxies, colour-coded to differentiate the clusters. The second column illustrates the SFMS for each clustering scenario, showing the SFR derived from stellar populations. The third column features the WHAN diagram for each set of clusters. In the last row we include a histogram showing the morphological distribution within each cluster, expressed as a percentage relative to the total number of each morphological type in the eCALIFA sample.
Current usage metrics show cumulative count of Article Views (full-text article views including HTML views, PDF and ePub downloads, according to the available data) and Abstracts Views on Vision4Press platform.
Data correspond to usage on the plateform after 2015. The current usage metrics is available 48-96 hours after online publication and is updated daily on week days.
Initial download of the metrics may take a while.