Fig. 4.
Download original image
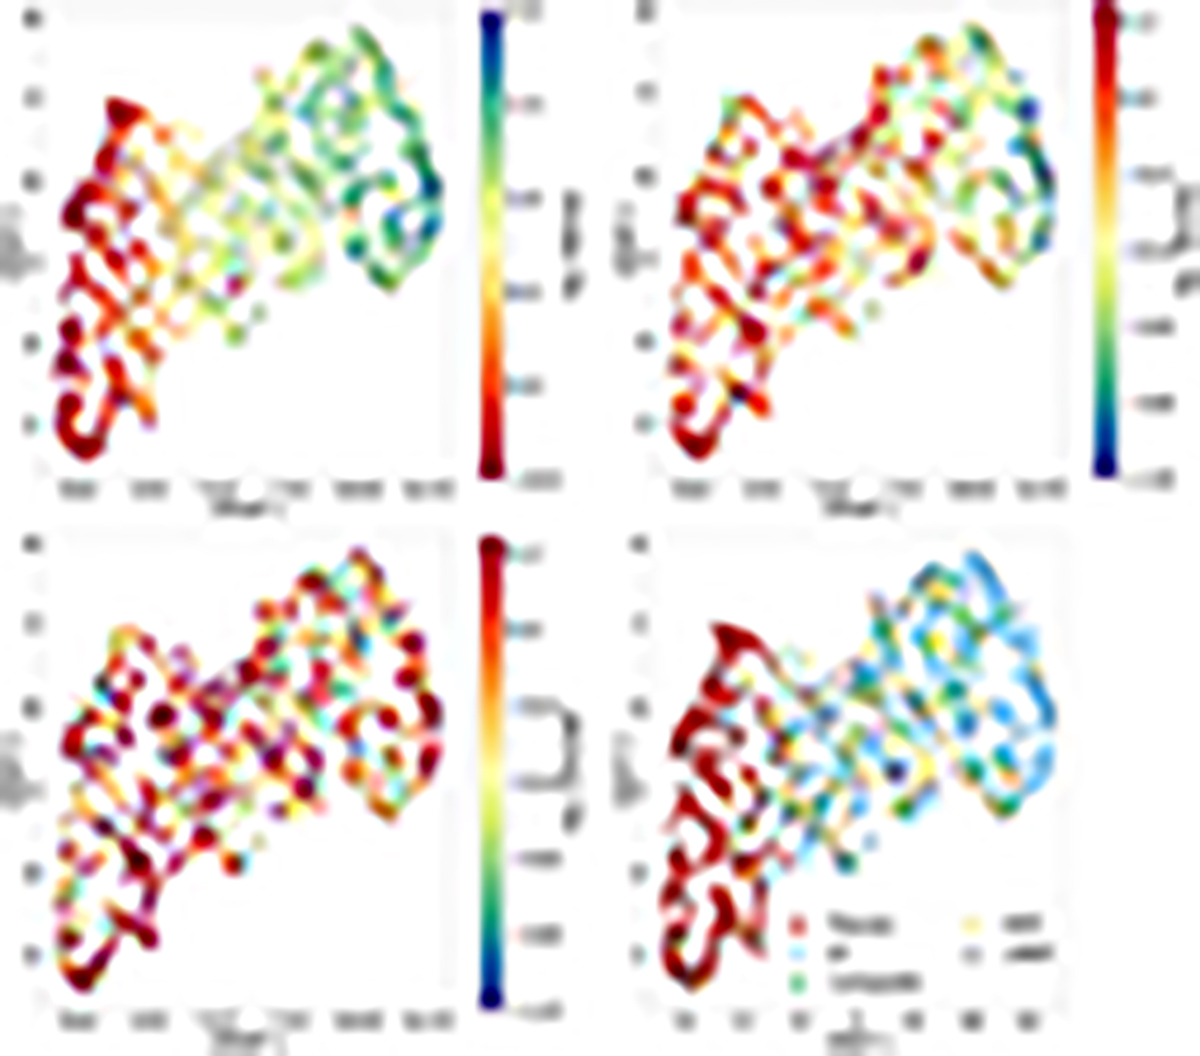
UMAP projection of embedded space, colour-coded by galaxy emission line properties and ionisation mechanisms. Top right: logarithm of the integrated EW of Hα. Top left: logarithm of the central [NII]/Hα ratio. Bottom left: logarithm of the central [OIII]/Hβ ratio. Bottom right: classification of galaxies according to their primary ionisation mechanism, categorised into AGN, Star-forming, LINERs, Passive, and Composite galaxies. Circles represent the training set, while stars denote the validation sample.
Current usage metrics show cumulative count of Article Views (full-text article views including HTML views, PDF and ePub downloads, according to the available data) and Abstracts Views on Vision4Press platform.
Data correspond to usage on the plateform after 2015. The current usage metrics is available 48-96 hours after online publication and is updated daily on week days.
Initial download of the metrics may take a while.