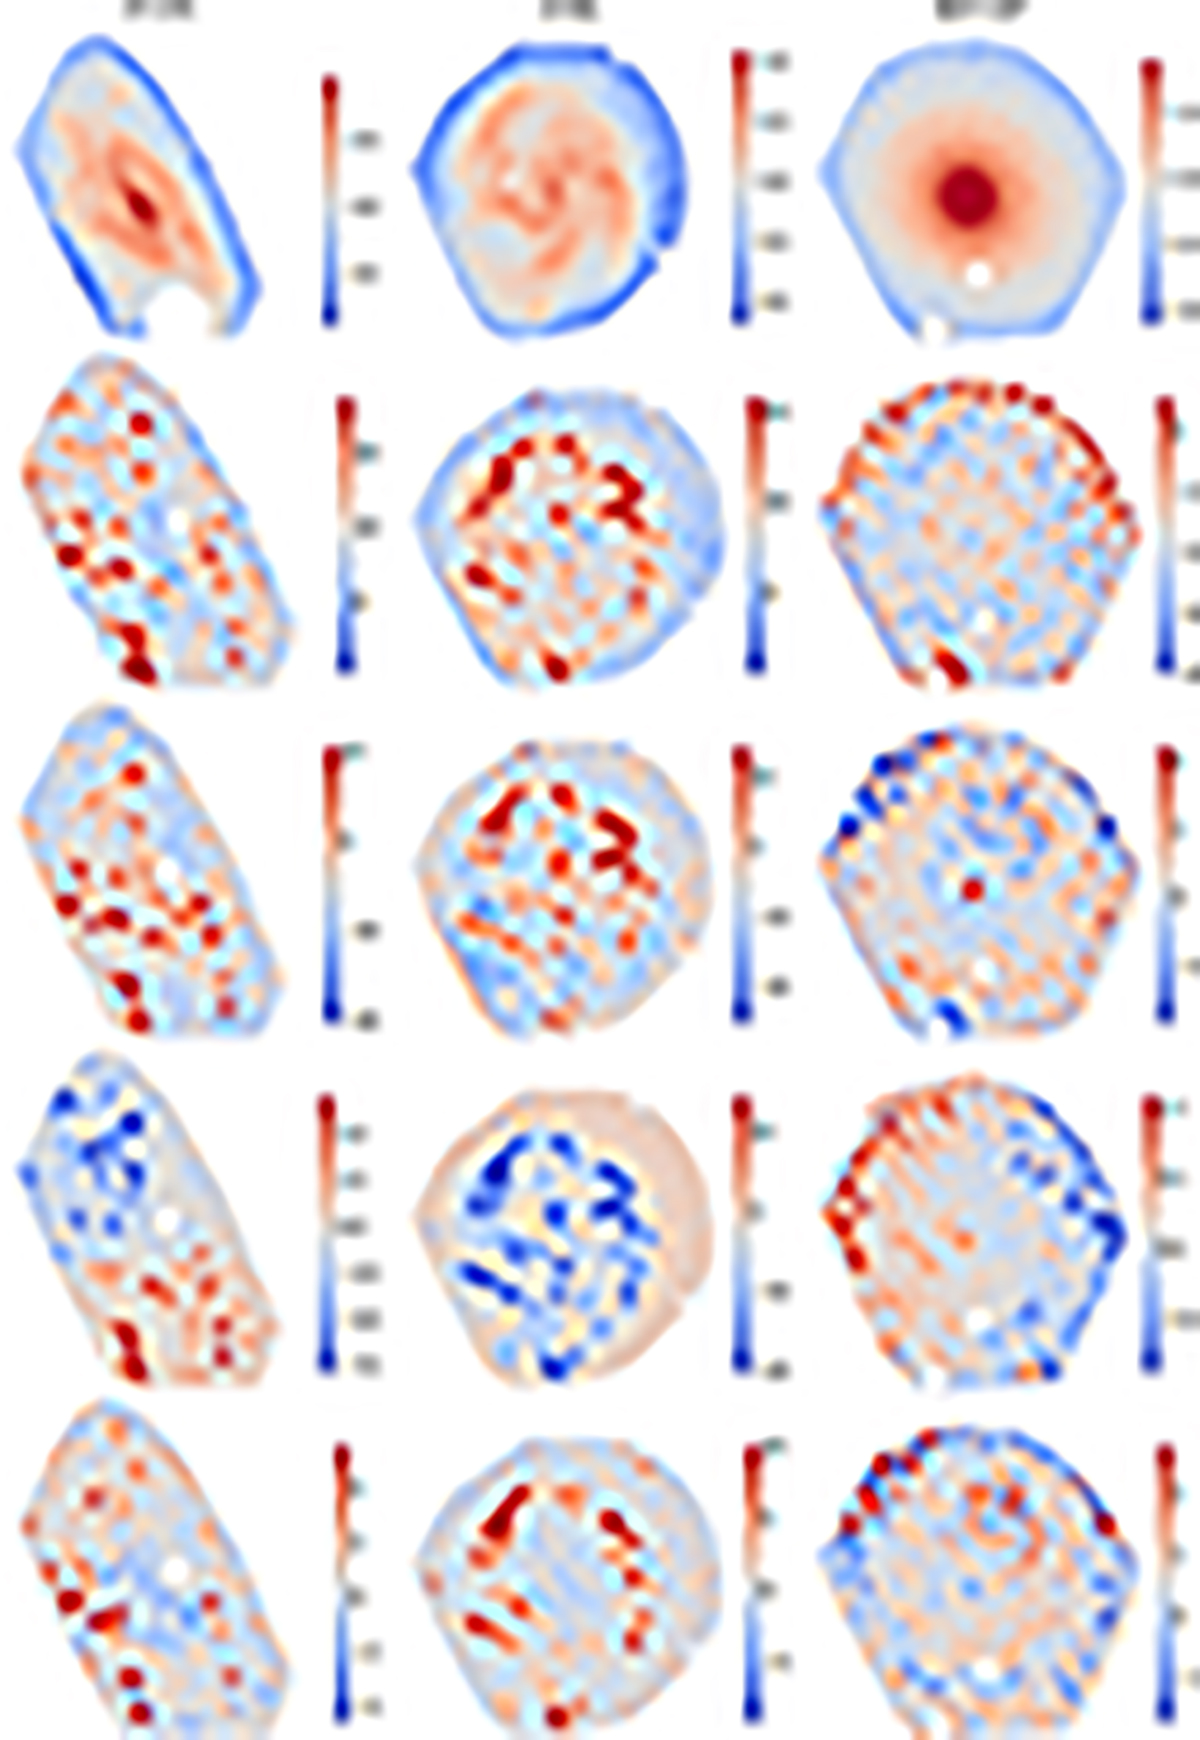
Fig. C.1.
Download original image
Visual representation of various data maps for three galaxies of eCALIFA survey, IC391, IC1151, and NGC1167. Each column corresponds to a galaxy, ordered from left to right. The first row displays the logarithmic luminosity maps at the normalise window (5700 Å) highlighting the distribution of light across each galaxy. The subsequent rows represent PCA maps of differing components: the second row shows PCA 0 maps; the third row contains PCA 1 maps; the fourth row illustrates PCA 2 maps; and the fifth row shows PCA 3 maps.
Current usage metrics show cumulative count of Article Views (full-text article views including HTML views, PDF and ePub downloads, according to the available data) and Abstracts Views on Vision4Press platform.
Data correspond to usage on the plateform after 2015. The current usage metrics is available 48-96 hours after online publication and is updated daily on week days.
Initial download of the metrics may take a while.