Fig. 1.
Download original image
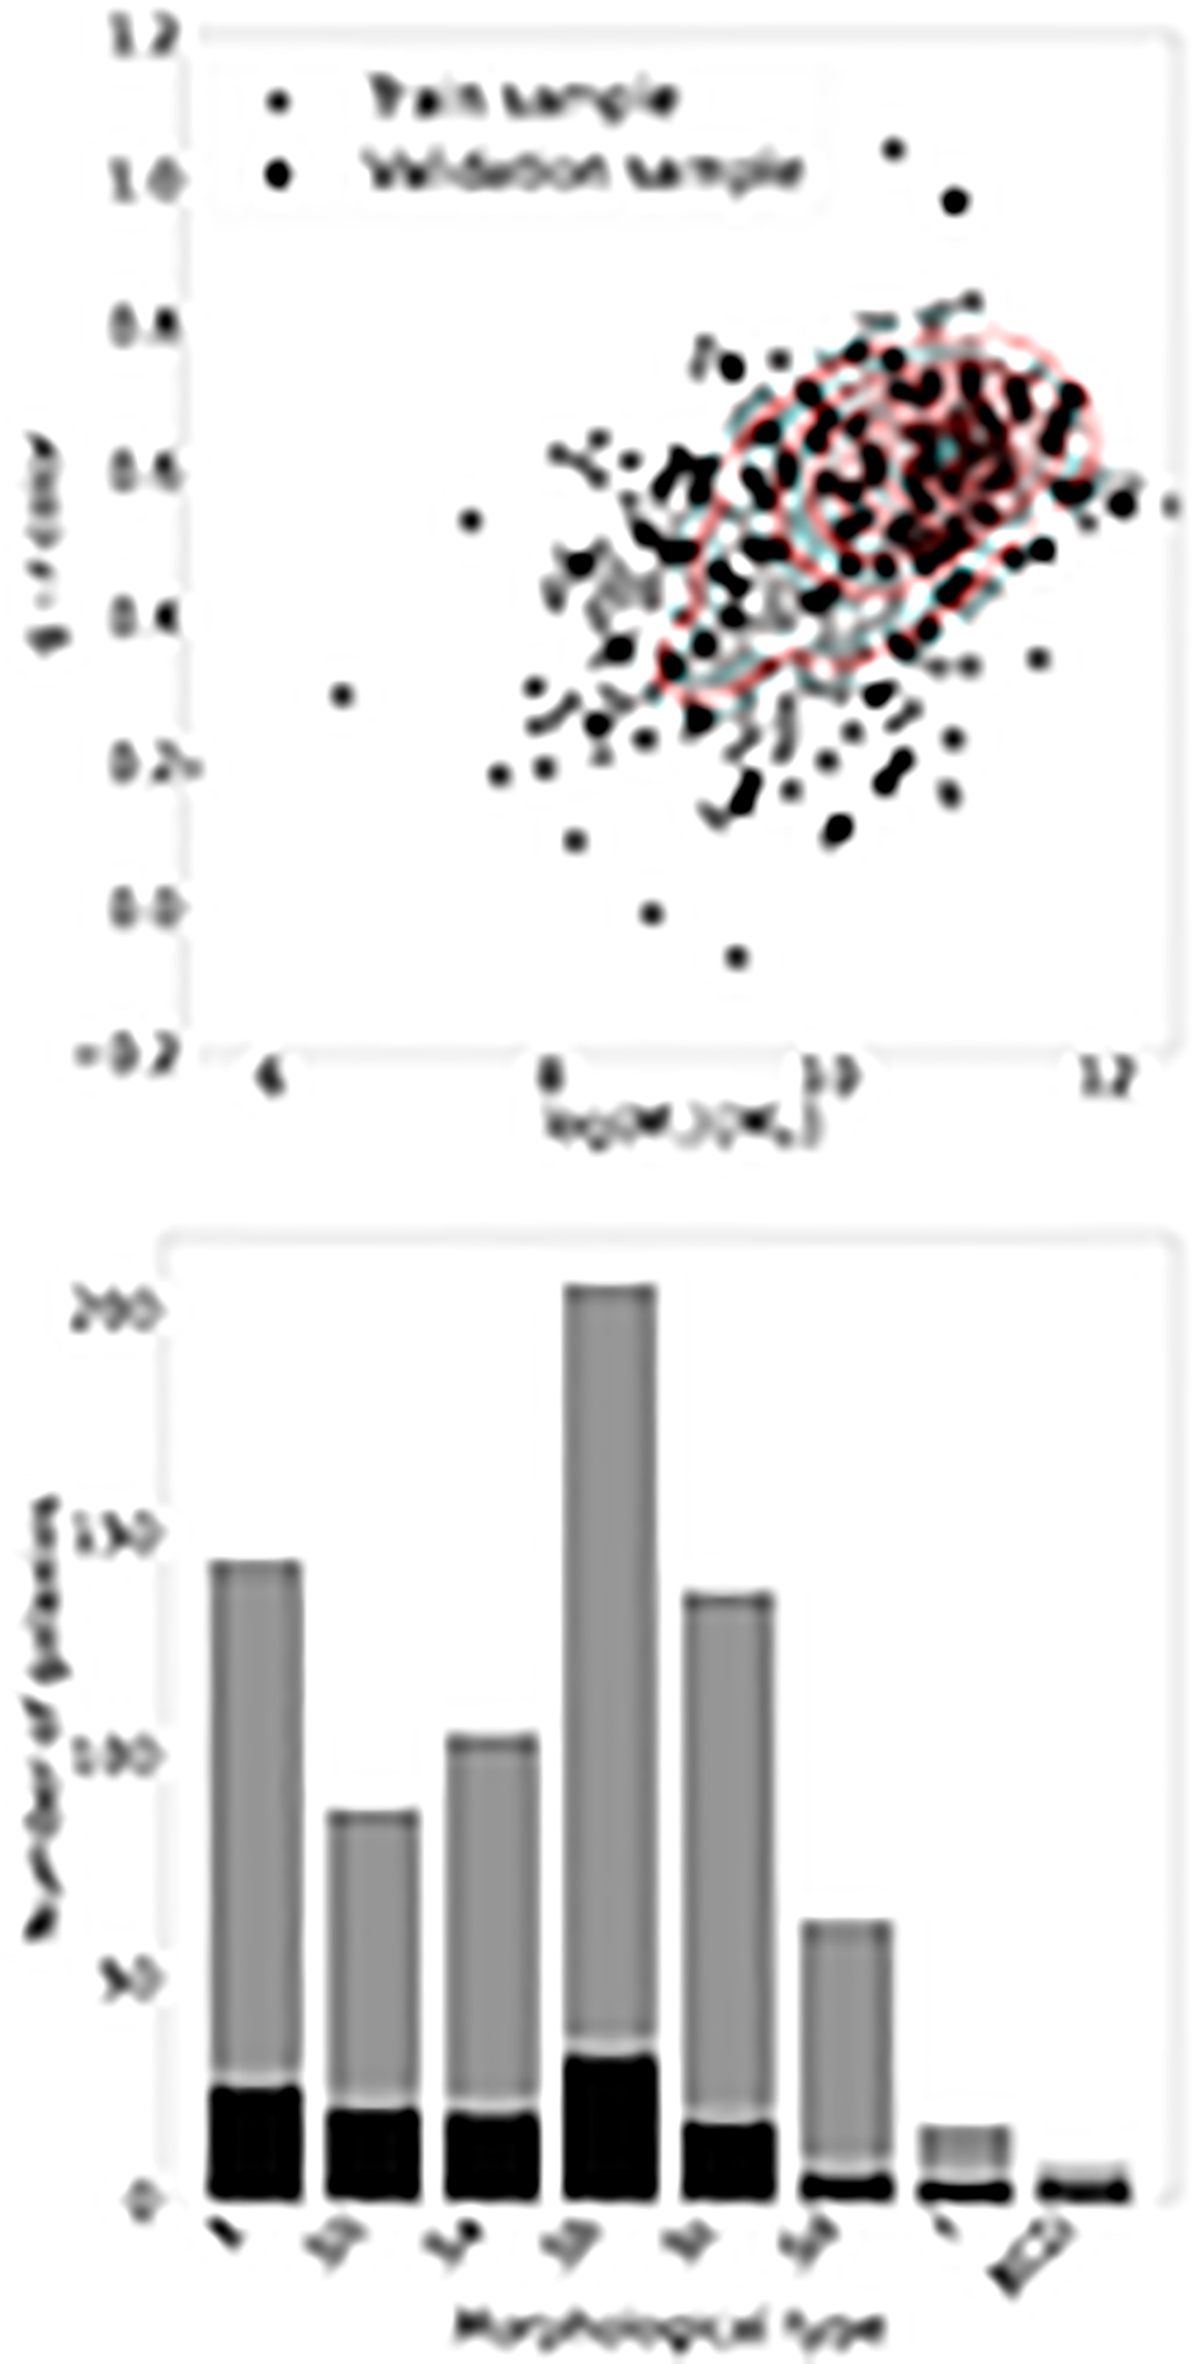
Properties of training and validation samples. Top: colour-mass diagram of galaxies in eCALIFA survey. We show the observed (g − r) colour in function of the stellar mass for both training and test samples. Density contours are drawn in red. Bottom: bar plot highlights the count of galaxies across different morphological categories, that is, E, S0, Sa, Sb, Sc, Sd, I, and BCD.
Current usage metrics show cumulative count of Article Views (full-text article views including HTML views, PDF and ePub downloads, according to the available data) and Abstracts Views on Vision4Press platform.
Data correspond to usage on the plateform after 2015. The current usage metrics is available 48-96 hours after online publication and is updated daily on week days.
Initial download of the metrics may take a while.