Fig. 3
Download original image
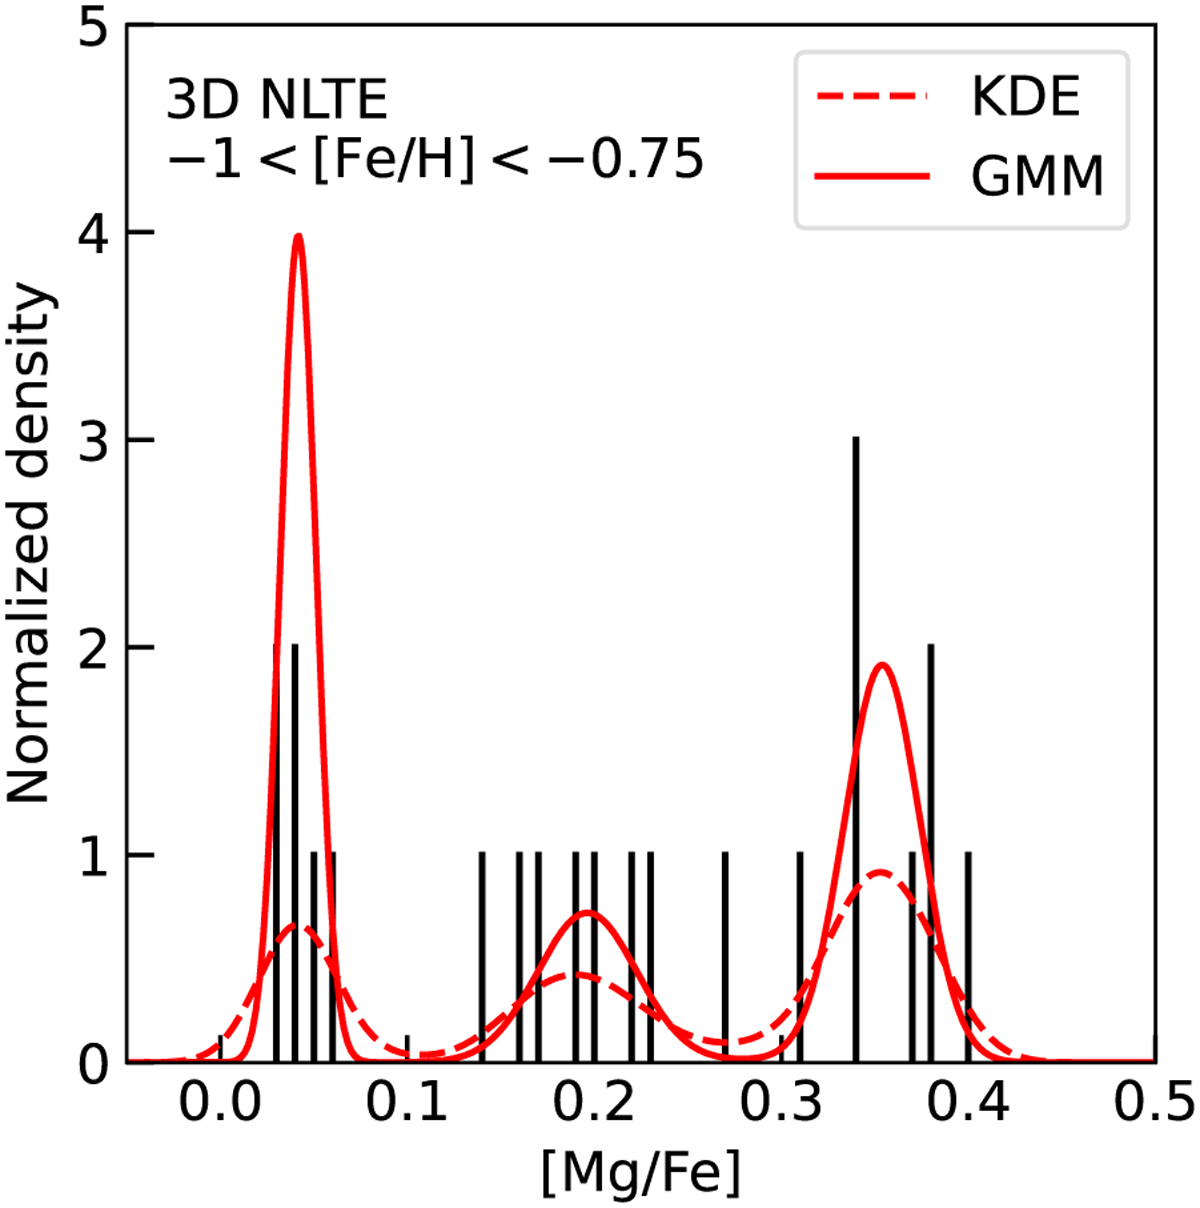
The [Mg/Fe] distribution of metal-rich halo stars with −1 < [Fe/H], The red solid line shows the estimated density based on a Gaussian mixture model (GMM) with three components, while the dashed line shows the density based on a Gaussian kernel density estimation (KDE) with bandwidths of 0.03 dex. Three peaks, corresponding to the α-rich population and the two α-poor sub-populations, are clearly visible in both density estimations.
Current usage metrics show cumulative count of Article Views (full-text article views including HTML views, PDF and ePub downloads, according to the available data) and Abstracts Views on Vision4Press platform.
Data correspond to usage on the plateform after 2015. The current usage metrics is available 48-96 hours after online publication and is updated daily on week days.
Initial download of the metrics may take a while.