Fig. 6.
Download original image
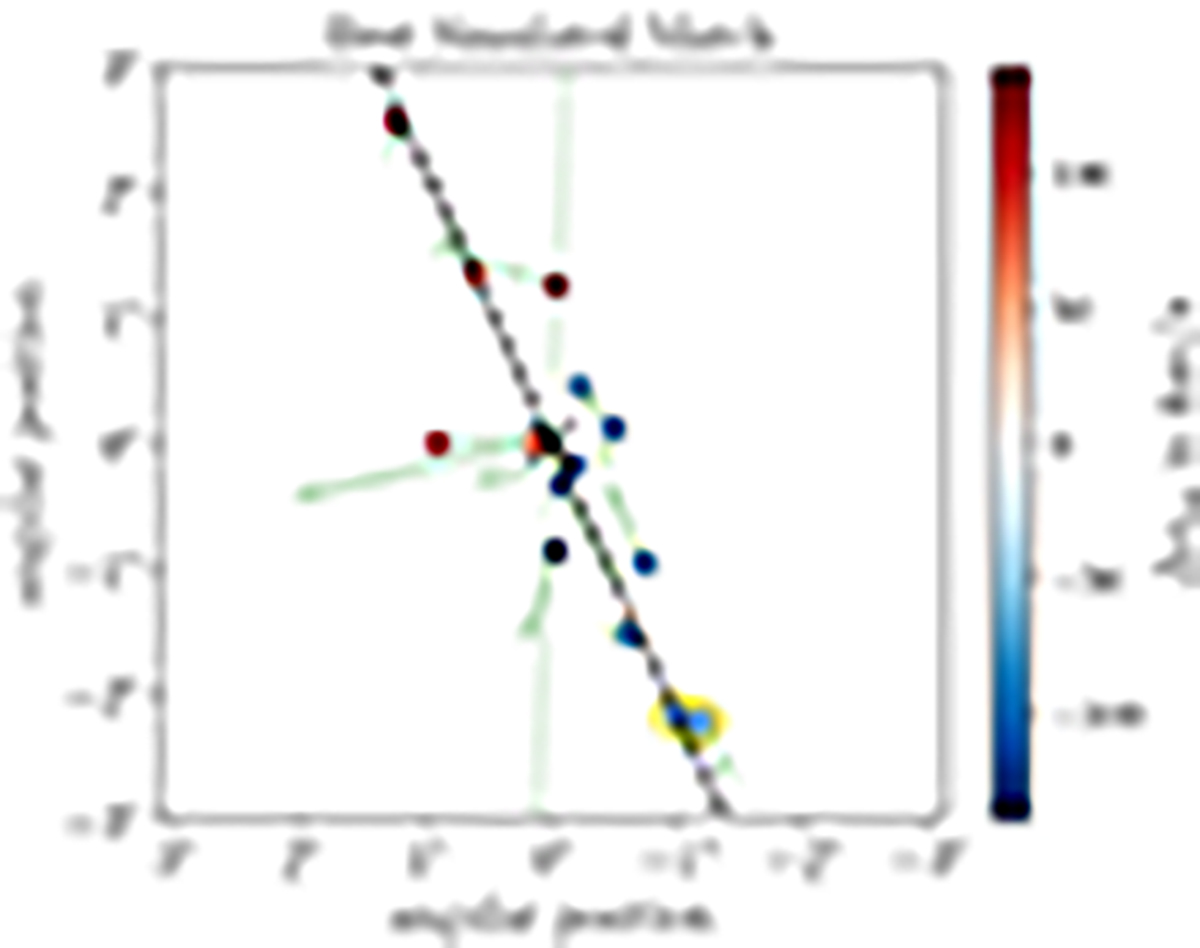
On-sky distribution of objects for the best-matching simulated analog of the observed system. The dashed line indicates the major axis of the projected distribution, the axis ratio is b/a = 0.24. Out of the 14 considered galaxies, 13 show a coherent velocity trend, and this would increase to 14 if the system were split along the dashed green line. The close pair of dwarf galaxies is highlighted with yellow circles. They are moving in the same direction, as indicated by the green arrows showing the (observationally inaccessible) on-sky motion of the simulated galaxies.
Current usage metrics show cumulative count of Article Views (full-text article views including HTML views, PDF and ePub downloads, according to the available data) and Abstracts Views on Vision4Press platform.
Data correspond to usage on the plateform after 2015. The current usage metrics is available 48-96 hours after online publication and is updated daily on week days.
Initial download of the metrics may take a while.