Fig. 6
Download original image
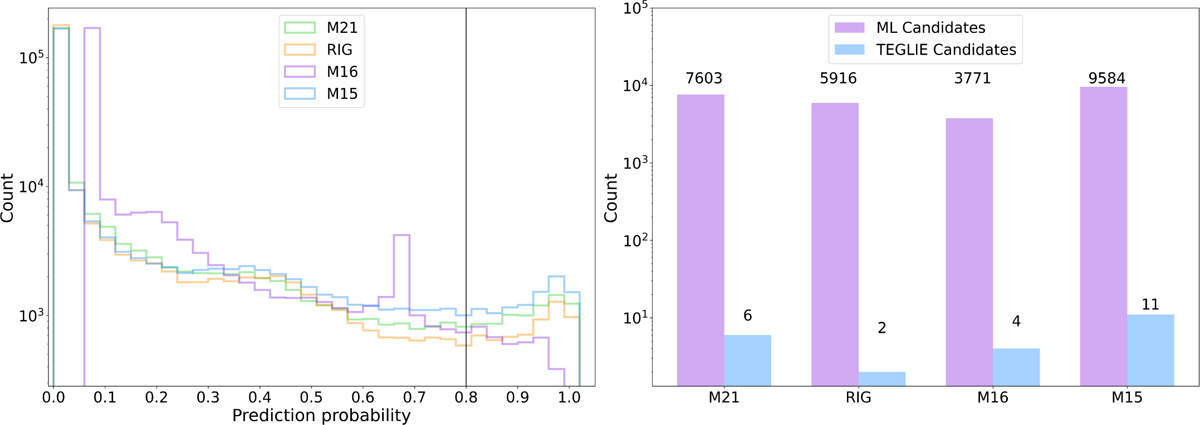
Prediction probability sample extracted from the ten tiles in Table 4. Left: prediction probability of the four models used in this work from Thuruthipilly et al. (2022). The black line shows the threshold probability; every object above 0.8 is considered an ML candidate. Right: total number of ML candidates compared to the TPs with grades 1 and 2 (TEGLIE candidates) for every model. Bar element counts are shown above each bar.
Current usage metrics show cumulative count of Article Views (full-text article views including HTML views, PDF and ePub downloads, according to the available data) and Abstracts Views on Vision4Press platform.
Data correspond to usage on the plateform after 2015. The current usage metrics is available 48-96 hours after online publication and is updated daily on week days.
Initial download of the metrics may take a while.