Fig. 16
Download original image
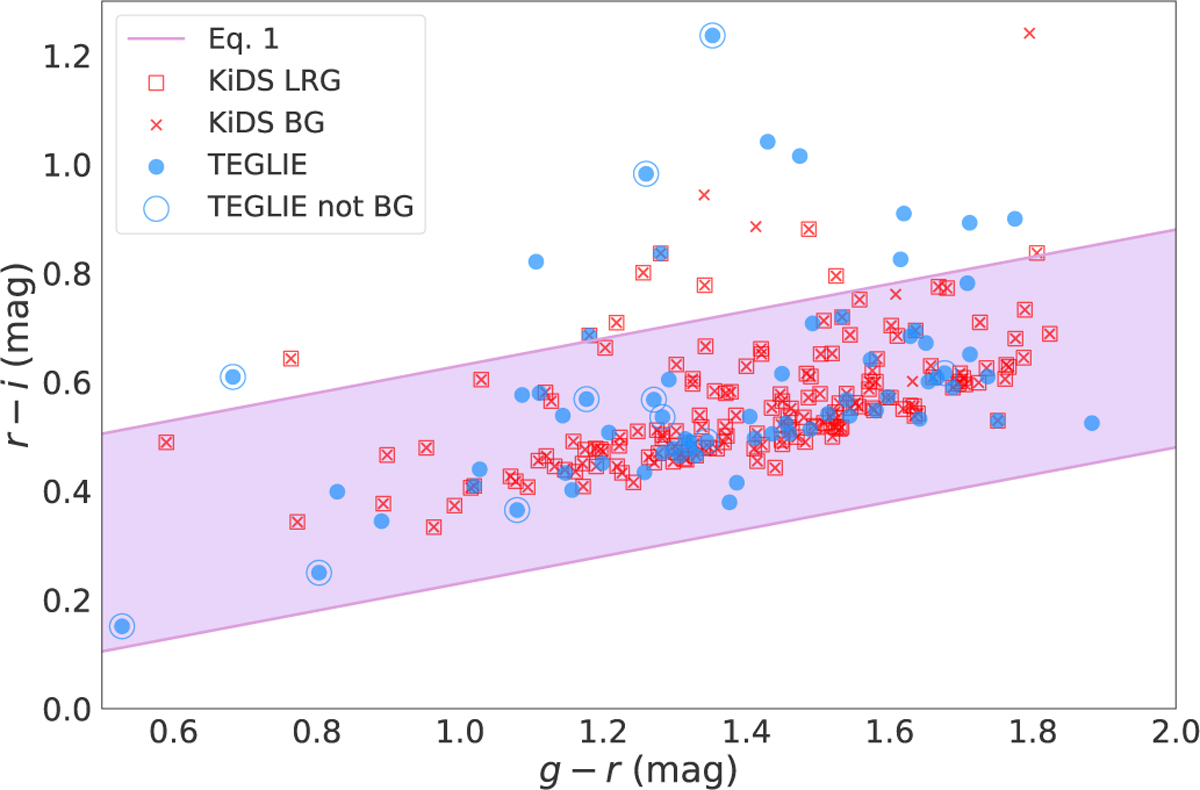
Visualization of the KiDS selection criteria for identifying LRGs and BGs through a color cut, as described in Sec. 2. Our model was applied to a sample without this specific color selection, allowing it to detect candidates that would have otherwise been excluded by the KiDS LRG–BG cut. The blue dots with a circle around are all the TEGLIE HQ (grade 1) candidates that would have been missed with the KiDS preselection. A solid pink line limits the boundaries of the bottom inequality in Eq. (1). The red crosses are the HQ KiDS lenses that satisfy the top inequality in Eq. (1); the red crosses represent all the objects passing the BG selection, as described in Sec. 2. Blue dots are the TEGLIE candidate while the blue circles are all the HQ TEGLIE that would have not been passed the KiDS color cut.
Current usage metrics show cumulative count of Article Views (full-text article views including HTML views, PDF and ePub downloads, according to the available data) and Abstracts Views on Vision4Press platform.
Data correspond to usage on the plateform after 2015. The current usage metrics is available 48-96 hours after online publication and is updated daily on week days.
Initial download of the metrics may take a while.