Fig. 15
Download original image
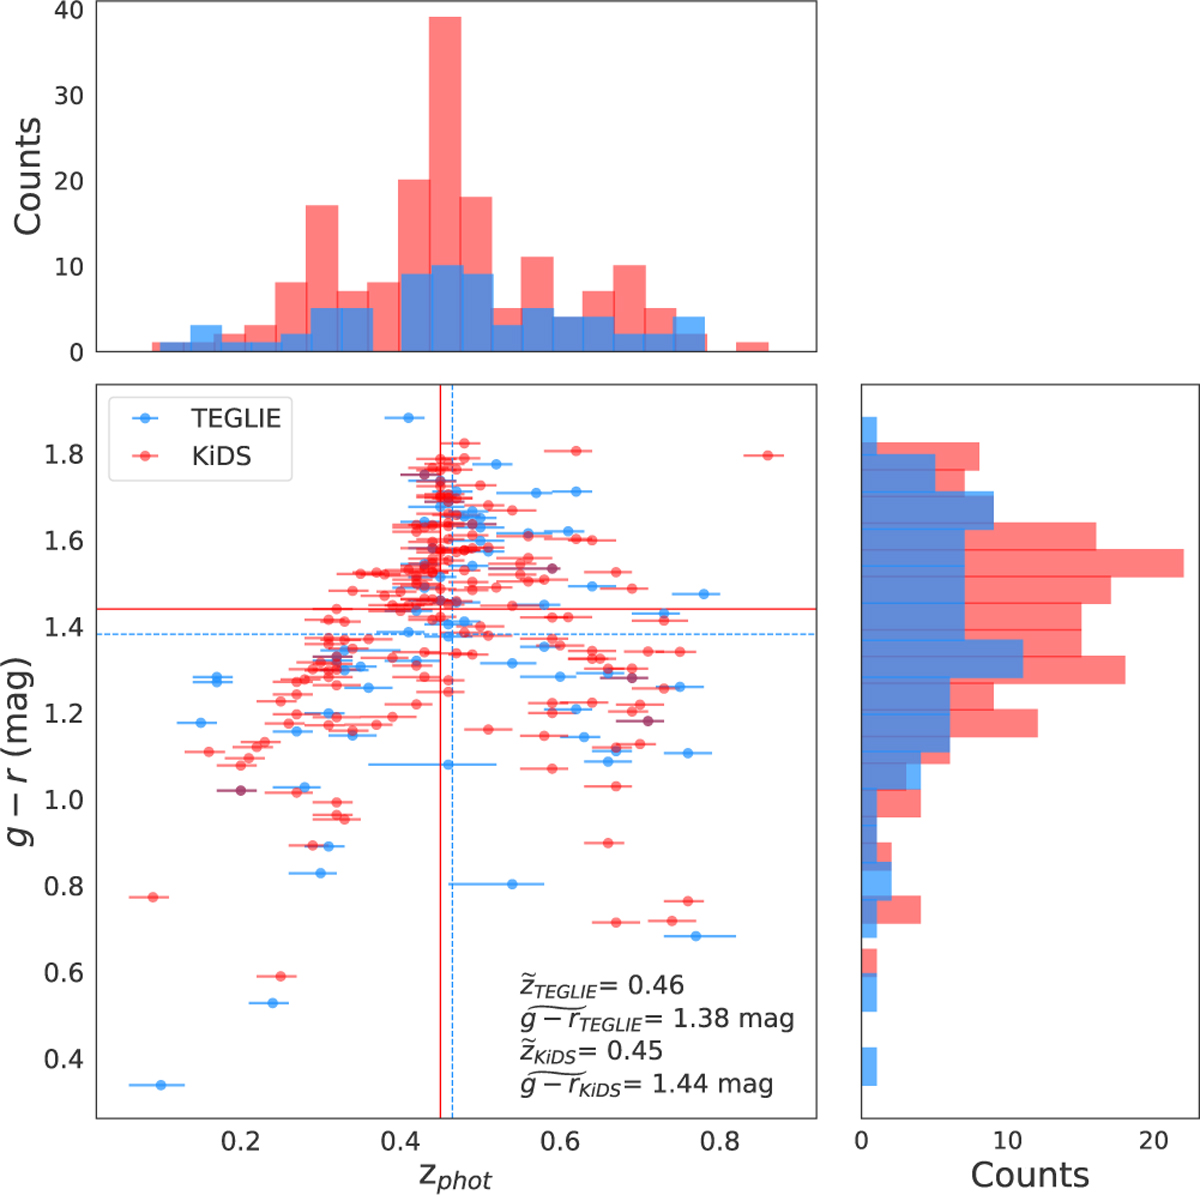
g − r observer-frame color corrected for Galactic extinction vs. photometric redshift. Red crosses represent lenses found by KiDS, with error bars indicating the range between the predicted maximum and minimum estimated redshift. Blue dots represent newly found HQ candidates. Histograms of redshift and color, for both populations, are plotted along each axis to better visualize the distribution of values. Values of the median color and estimated redshift for both populations are represented by dashed lines (TEGLIE) or solid lines (KiDS) and reported in the plot.
Current usage metrics show cumulative count of Article Views (full-text article views including HTML views, PDF and ePub downloads, according to the available data) and Abstracts Views on Vision4Press platform.
Data correspond to usage on the plateform after 2015. The current usage metrics is available 48-96 hours after online publication and is updated daily on week days.
Initial download of the metrics may take a while.