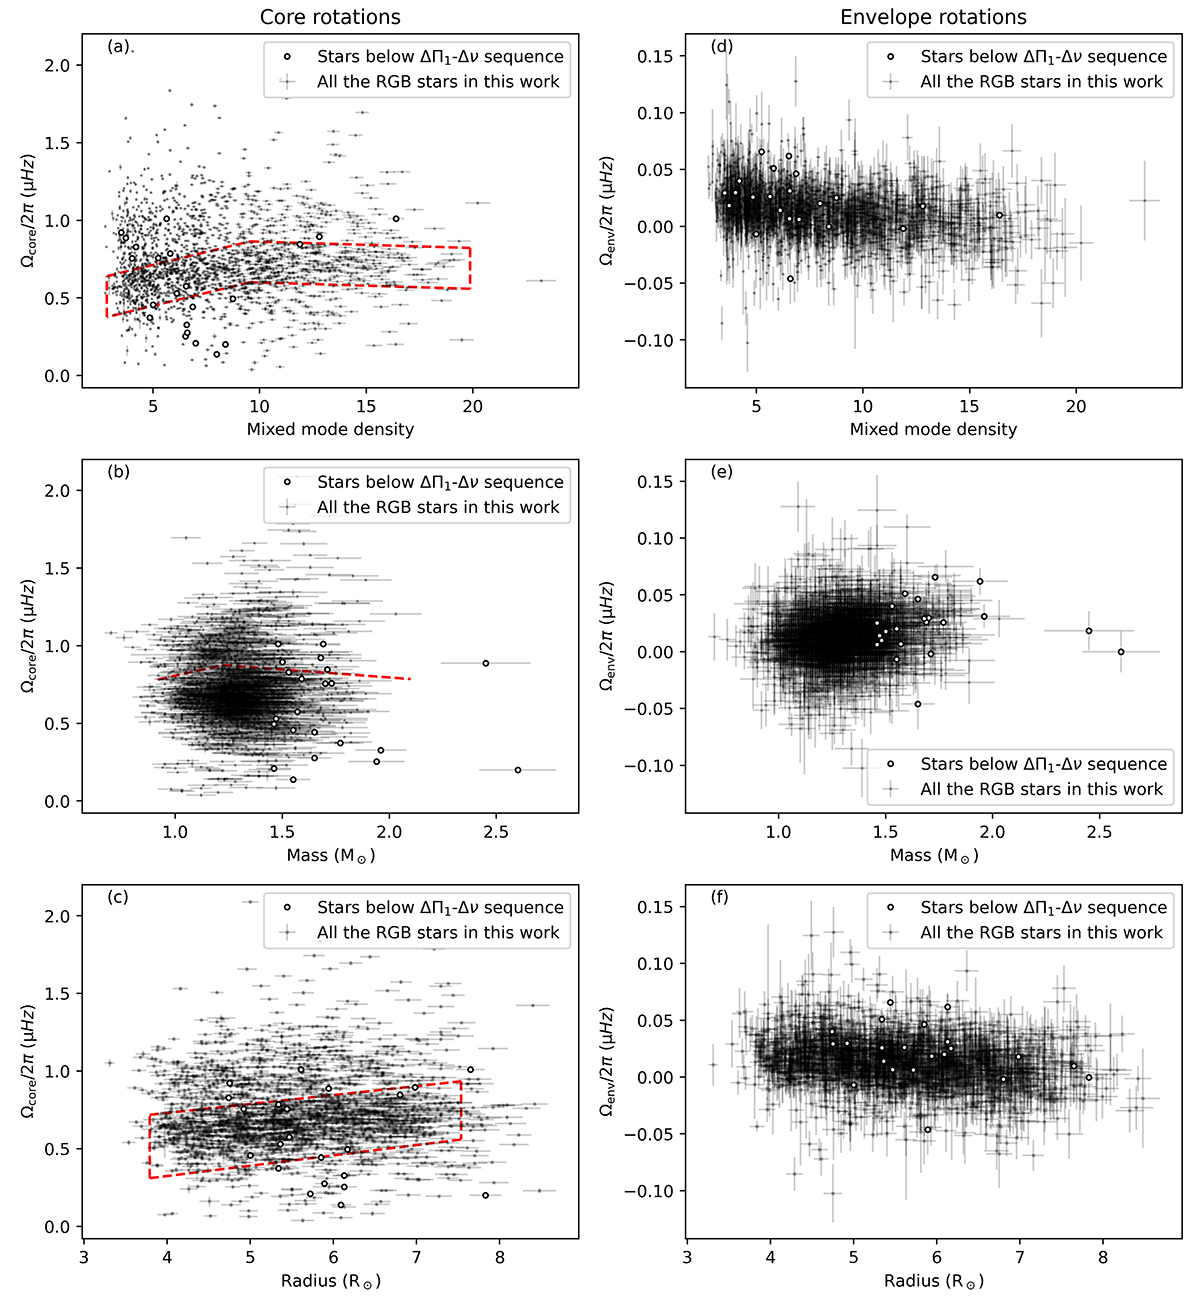
Fig. 9.
Download original image
Results of the core and the envelope rotation rates of our sample. The left column (panels a, b, c) shows the core rotation rates as a function of mixed mode density, stellar mass, and radius. The right column (panels d, e, f) is the counterpart of envelope rotations. The open points are the stars identified below the ΔΠ1–Δν sequence in Fig. 14. The dashed lines in panel (a) circle the over-density ridge.
Current usage metrics show cumulative count of Article Views (full-text article views including HTML views, PDF and ePub downloads, according to the available data) and Abstracts Views on Vision4Press platform.
Data correspond to usage on the plateform after 2015. The current usage metrics is available 48-96 hours after online publication and is updated daily on week days.
Initial download of the metrics may take a while.