Open Access
Fig. 7.
Download original image
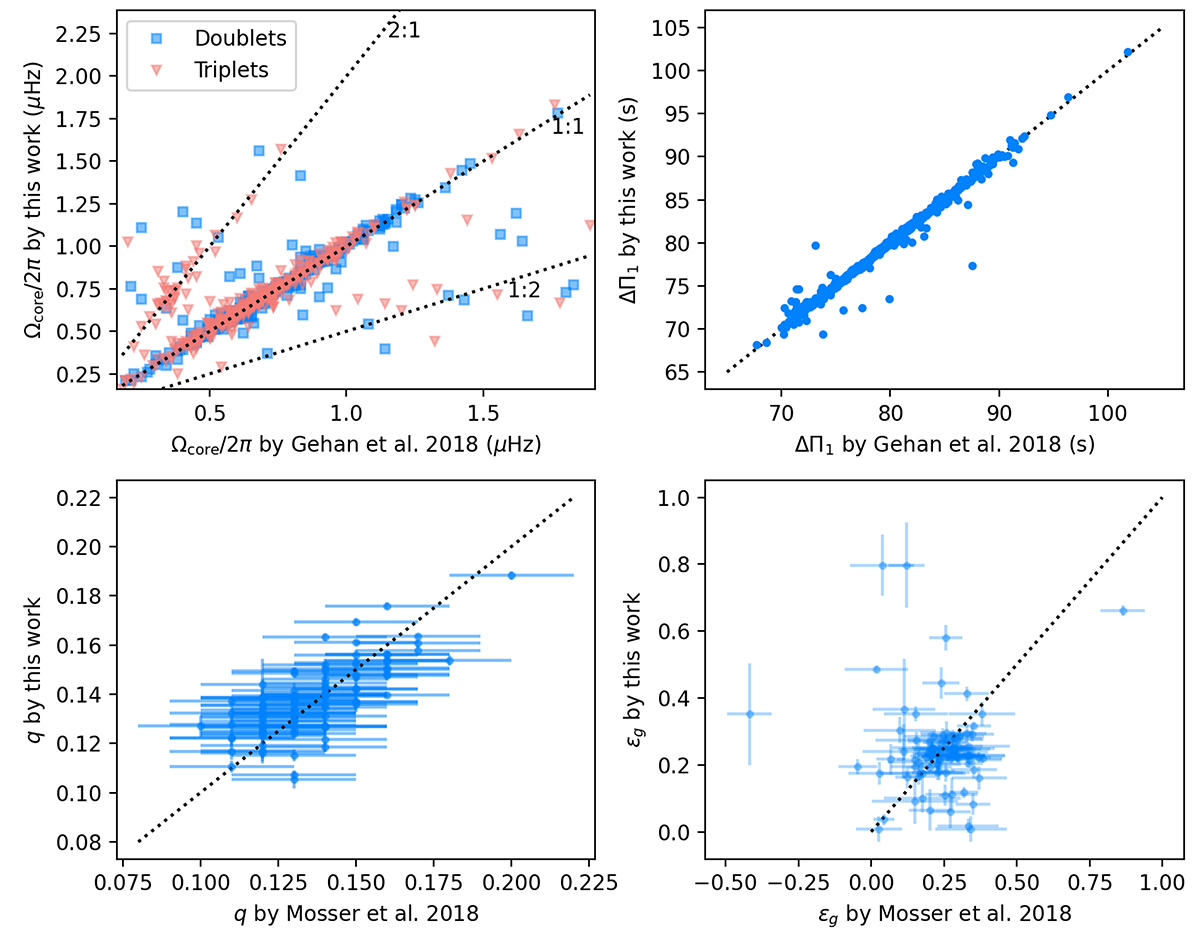
Comparison between our result with previous studies. Top left: core rotation rate Ωcore. Top right: period spacing ΔΠ1. Bottom left: coupling factor q. Bottom right: g-mode phase εg. the dashed line in each panel shows the 1:1 relation, or 2:1 and 1:2 as marked.
Current usage metrics show cumulative count of Article Views (full-text article views including HTML views, PDF and ePub downloads, according to the available data) and Abstracts Views on Vision4Press platform.
Data correspond to usage on the plateform after 2015. The current usage metrics is available 48-96 hours after online publication and is updated daily on week days.
Initial download of the metrics may take a while.