Fig. 5.
Download original image
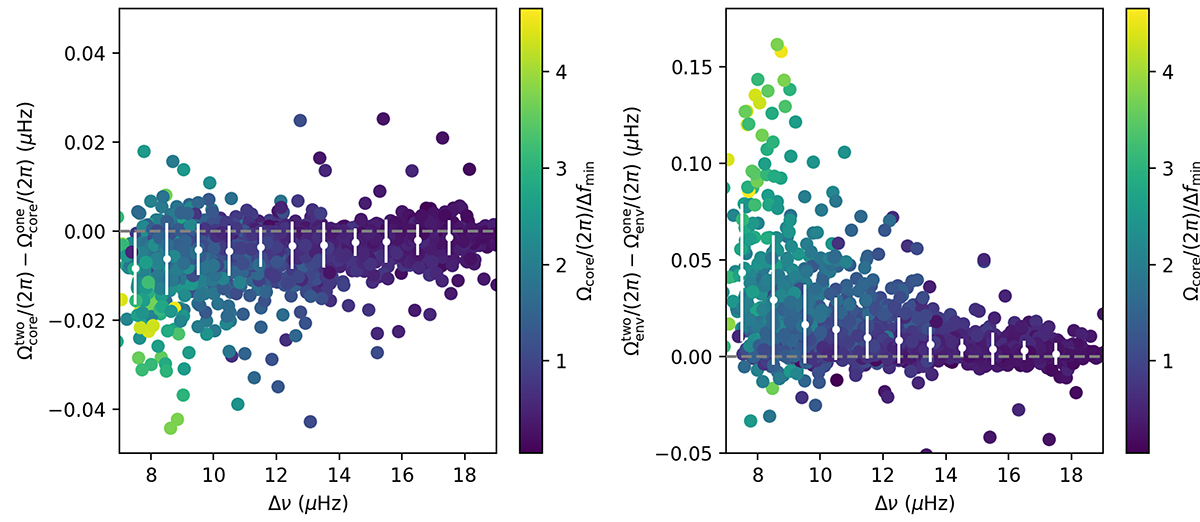
Differences of the core and envelope rotation rates between approaches two and one (defined as the results from approach two minus the results from approach one). The colour bar represents the extent of the NDE (see Fig. 4 and Sect. 3.1). The horizontal dashed lines mark the location where the values are equal. The white error bars show the mean and standard deviations in each bin of Δν.
Current usage metrics show cumulative count of Article Views (full-text article views including HTML views, PDF and ePub downloads, according to the available data) and Abstracts Views on Vision4Press platform.
Data correspond to usage on the plateform after 2015. The current usage metrics is available 48-96 hours after online publication and is updated daily on week days.
Initial download of the metrics may take a while.