Open Access
Fig. 4.
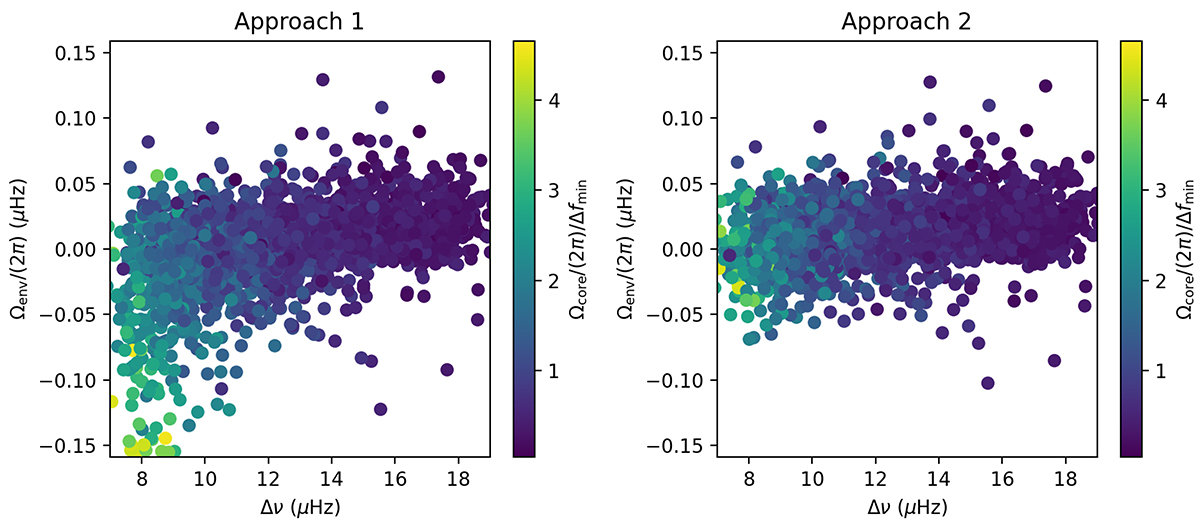
Download original image
Envelope rotation rates derived by approaches one and two. The colour bar indicates the intensity of NDE, calculated as the ratio between the core rotation and Δfmin, which is the smallest frequency separation between consecutive l = 1 mixed modes around νmax (see Sect. 3.1).
Current usage metrics show cumulative count of Article Views (full-text article views including HTML views, PDF and ePub downloads, according to the available data) and Abstracts Views on Vision4Press platform.
Data correspond to usage on the plateform after 2015. The current usage metrics is available 48-96 hours after online publication and is updated daily on week days.
Initial download of the metrics may take a while.