Fig. C.2
Download original image
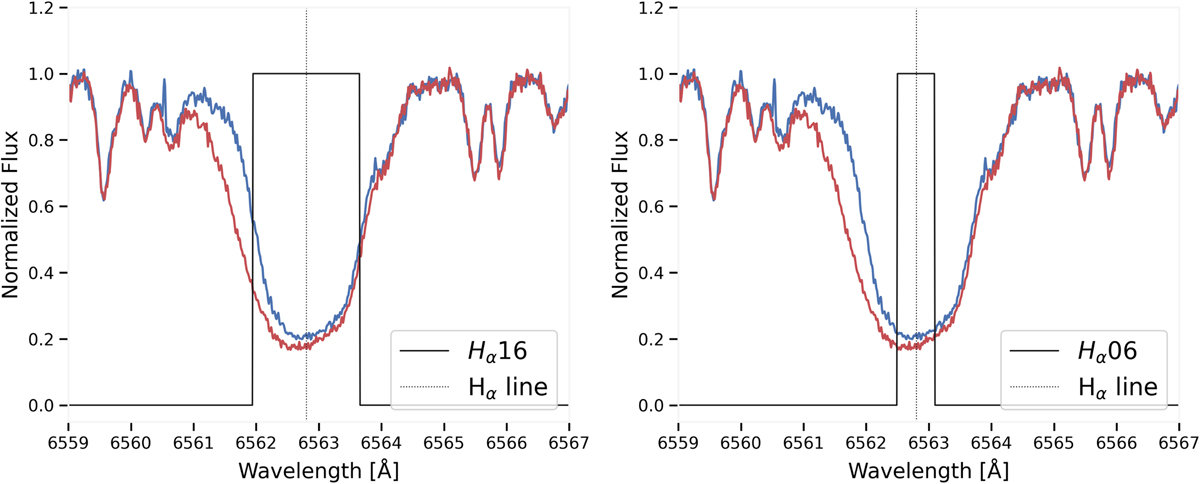
Example of the Hα line profile difference of two spectra obtained at different times for star NGC2345No50 (depicted by the blue and red lines). In black are represented the two different bandpasses (Hα16 on the left and Hα06 on the right), around the Hα line centre, used to compute the Hα index for the individual spectra of the stars with ACTIN 2.
Current usage metrics show cumulative count of Article Views (full-text article views including HTML views, PDF and ePub downloads, according to the available data) and Abstracts Views on Vision4Press platform.
Data correspond to usage on the plateform after 2015. The current usage metrics is available 48-96 hours after online publication and is updated daily on week days.
Initial download of the metrics may take a while.