Fig. 3
Download original image
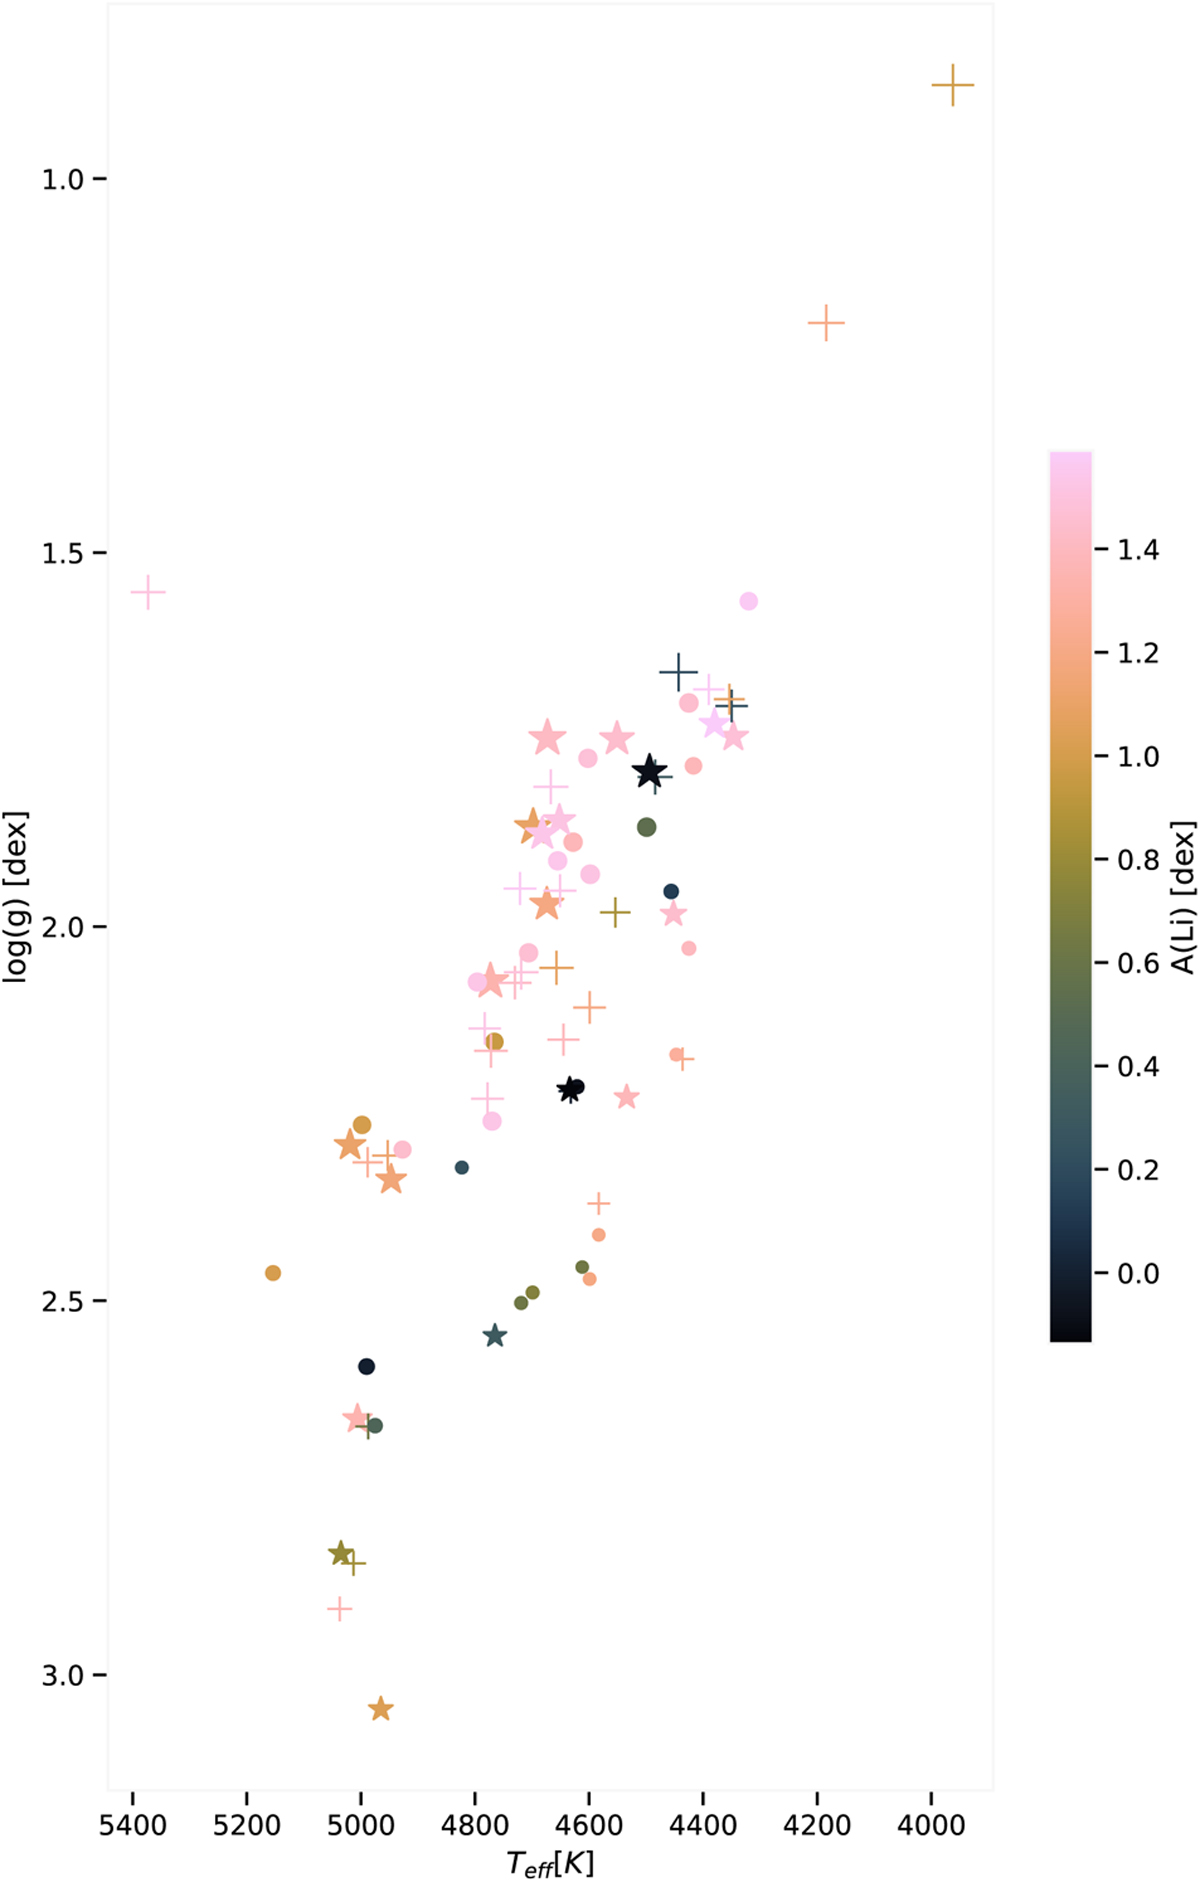
Hertzsprung-Russell diagram of all the stars in our sample. Here we use the log(g) and Teff derived in Tsantaki et al. (2023) for each star. The stars are coloured according to A(Li) and have different sizes to represent their different masses. The different symbols indicate how many strong correlations were found in a particular star: “•” indicates zero strong correlations, “★” indicates one strong correlation, and “+” indicates two or more strong correlations.
Current usage metrics show cumulative count of Article Views (full-text article views including HTML views, PDF and ePub downloads, according to the available data) and Abstracts Views on Vision4Press platform.
Data correspond to usage on the plateform after 2015. The current usage metrics is available 48-96 hours after online publication and is updated daily on week days.
Initial download of the metrics may take a while.