Fig. 2
Download original image
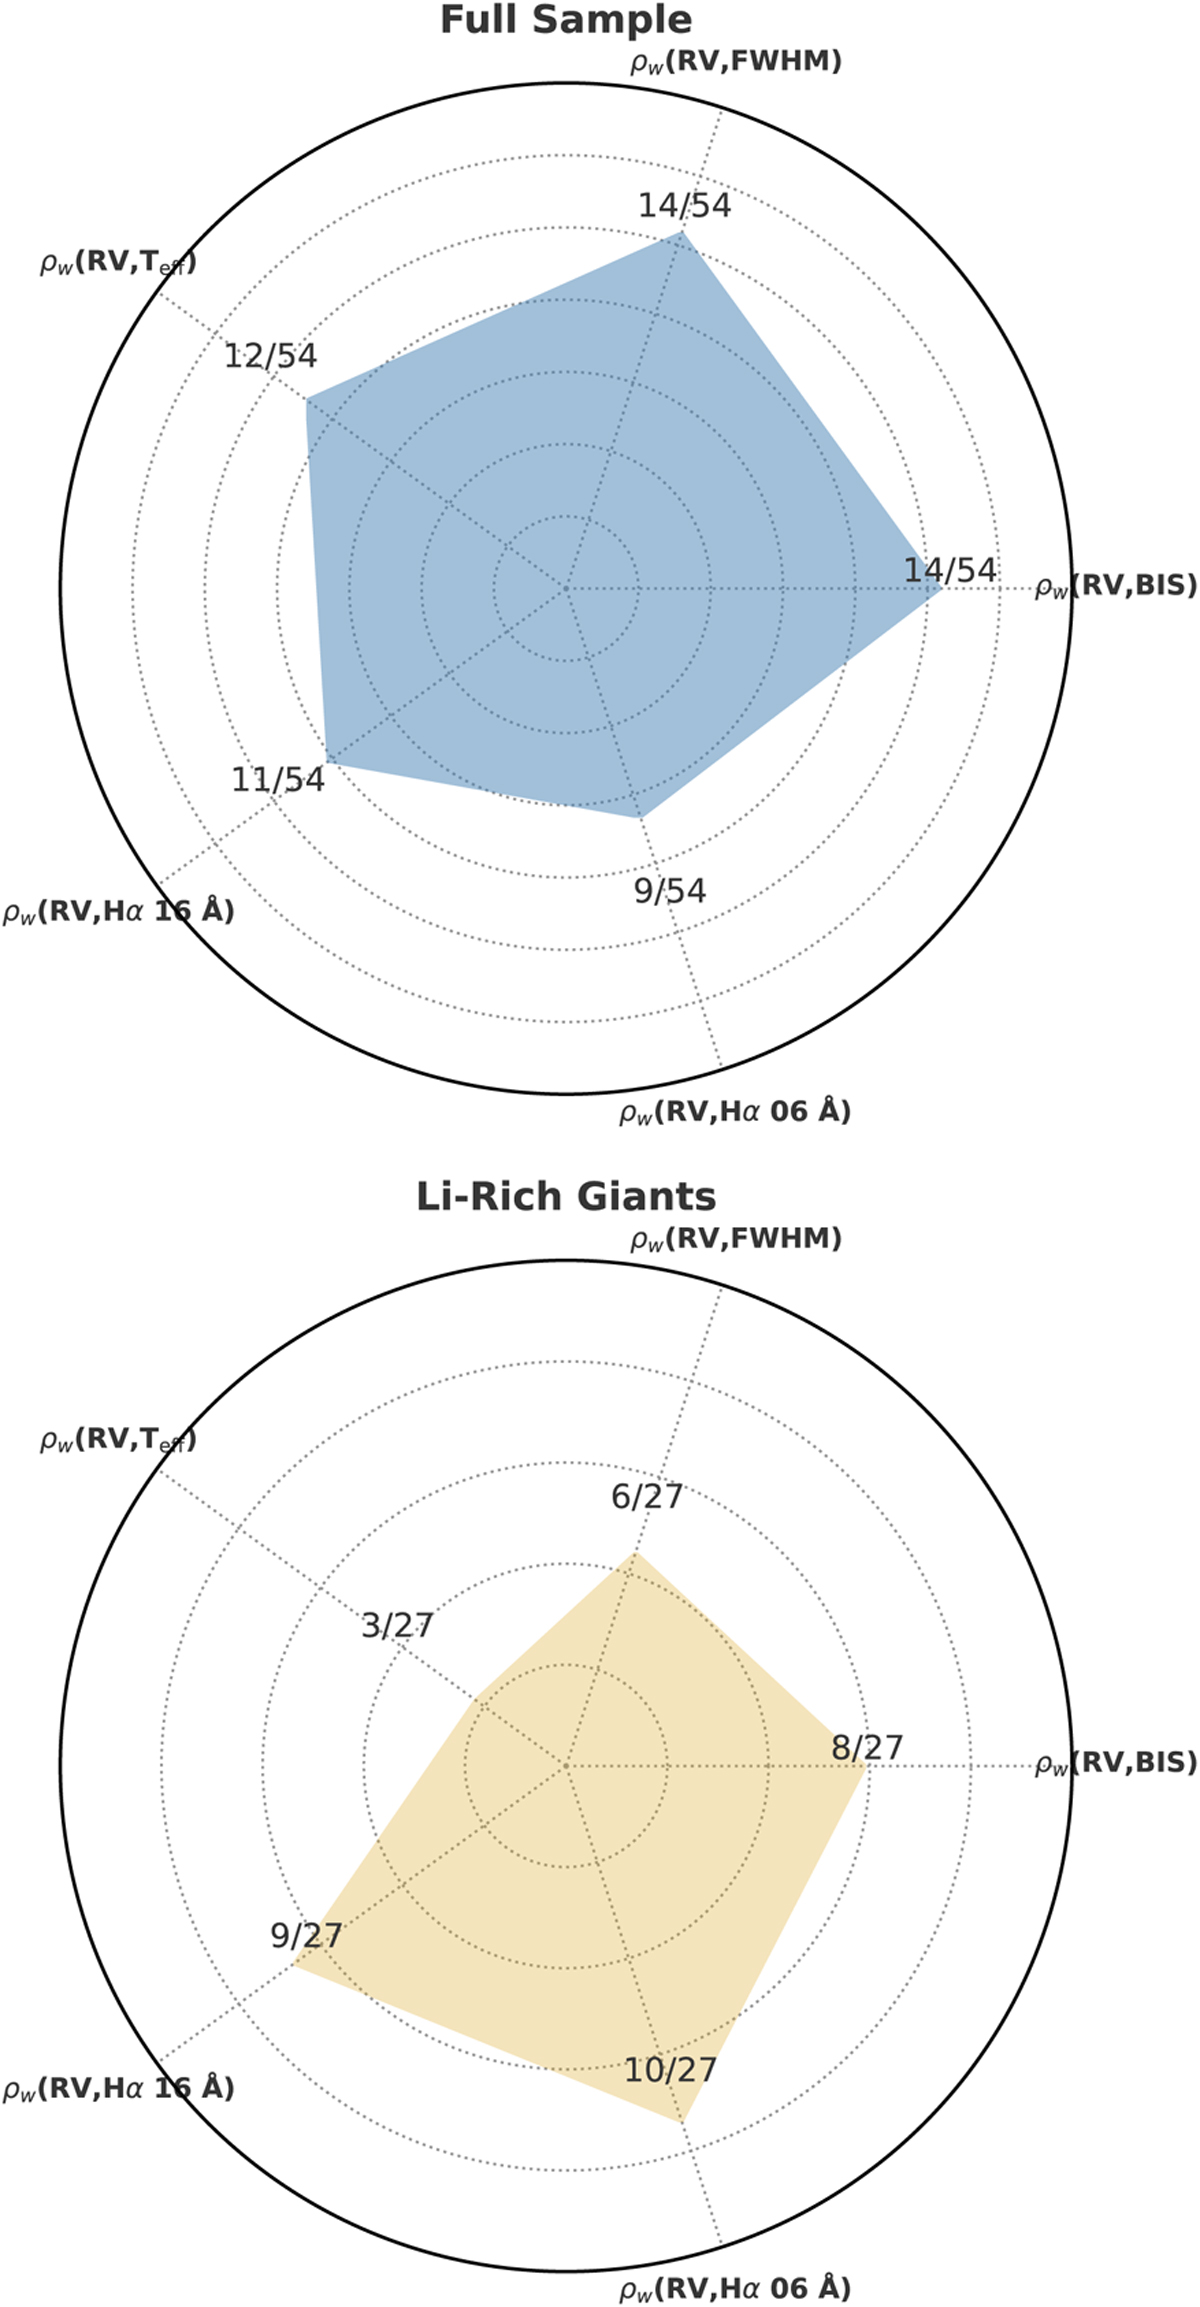
Spider charts showing the number of strong correlations found. The top chart shows how many strong correlations were found between RV and every stellar activity indicator in the full sample of red giant stars. The bottom chart shows how many strong correlations were found between RV and every stellar activity indicator for the stars of interest listed in Table 2.
Current usage metrics show cumulative count of Article Views (full-text article views including HTML views, PDF and ePub downloads, according to the available data) and Abstracts Views on Vision4Press platform.
Data correspond to usage on the plateform after 2015. The current usage metrics is available 48-96 hours after online publication and is updated daily on week days.
Initial download of the metrics may take a while.