Fig. 1
Download original image
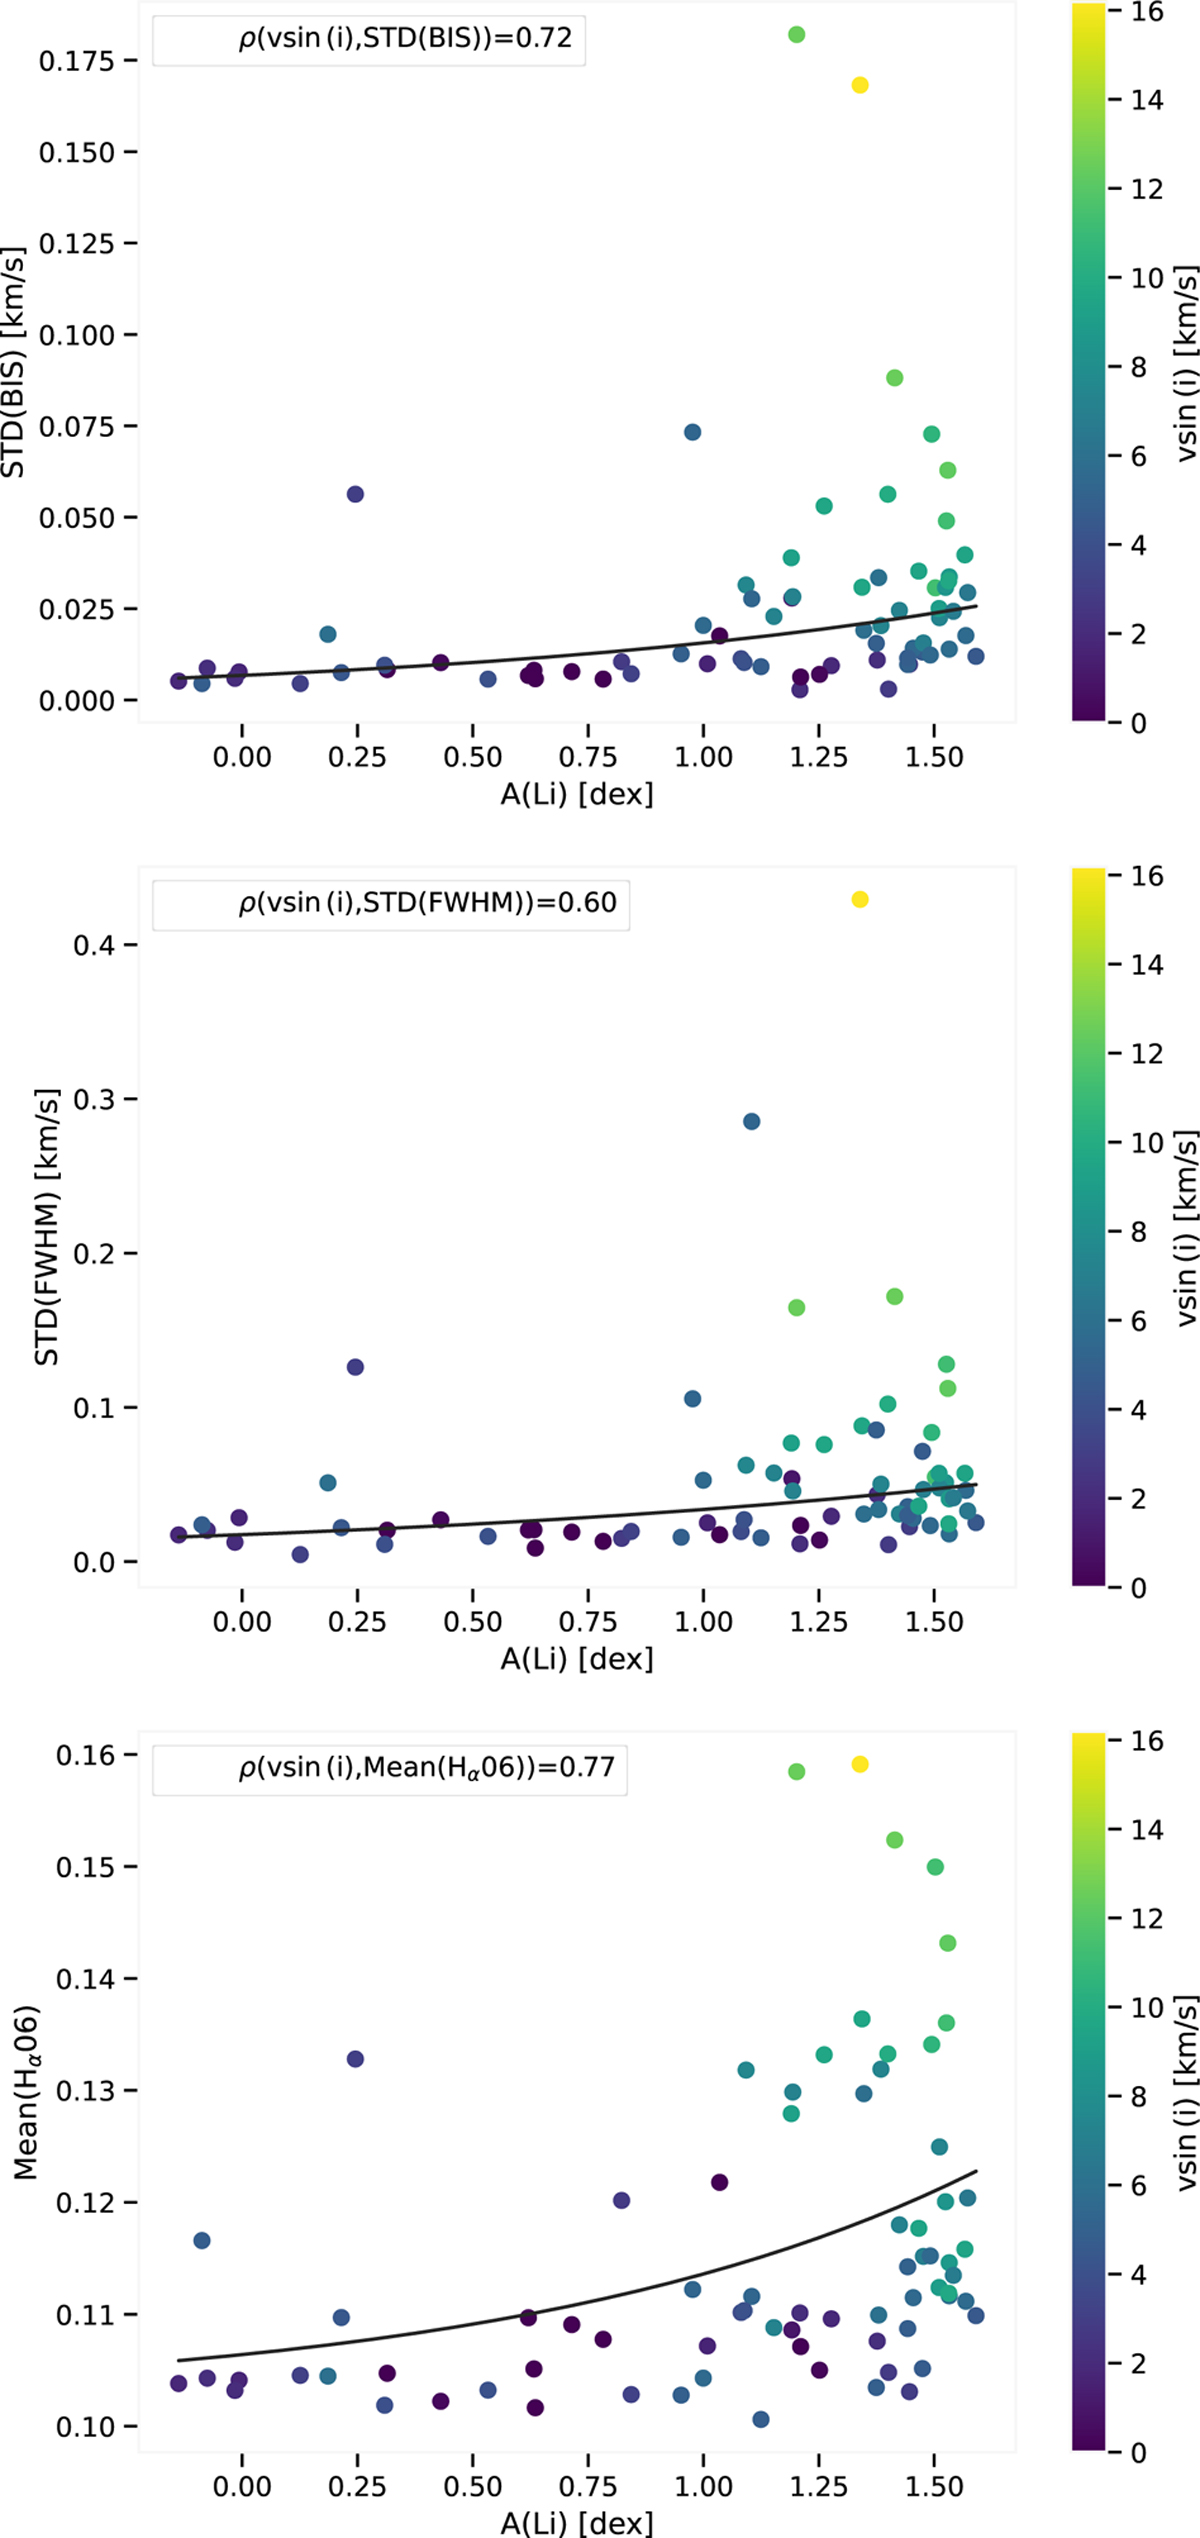
Exponential relation found between the STD of BIS data for each star and A(Li) [top panel], the STD of FWHM data for each star and A(Li) [middle panel], and the mean of Hα06 data for each star and A(Li) [bottom panel]. The data points are coloured according to the υ sin(i) of each star. The black lines are the lines of best fit for which the F-test statistics and p-values are listed in Table 3. In these plots we also show the Pearson correlation coefficients (p) between the activity proxies used and υ sin(i); all of them are very strong (>0.6).
Current usage metrics show cumulative count of Article Views (full-text article views including HTML views, PDF and ePub downloads, according to the available data) and Abstracts Views on Vision4Press platform.
Data correspond to usage on the plateform after 2015. The current usage metrics is available 48-96 hours after online publication and is updated daily on week days.
Initial download of the metrics may take a while.