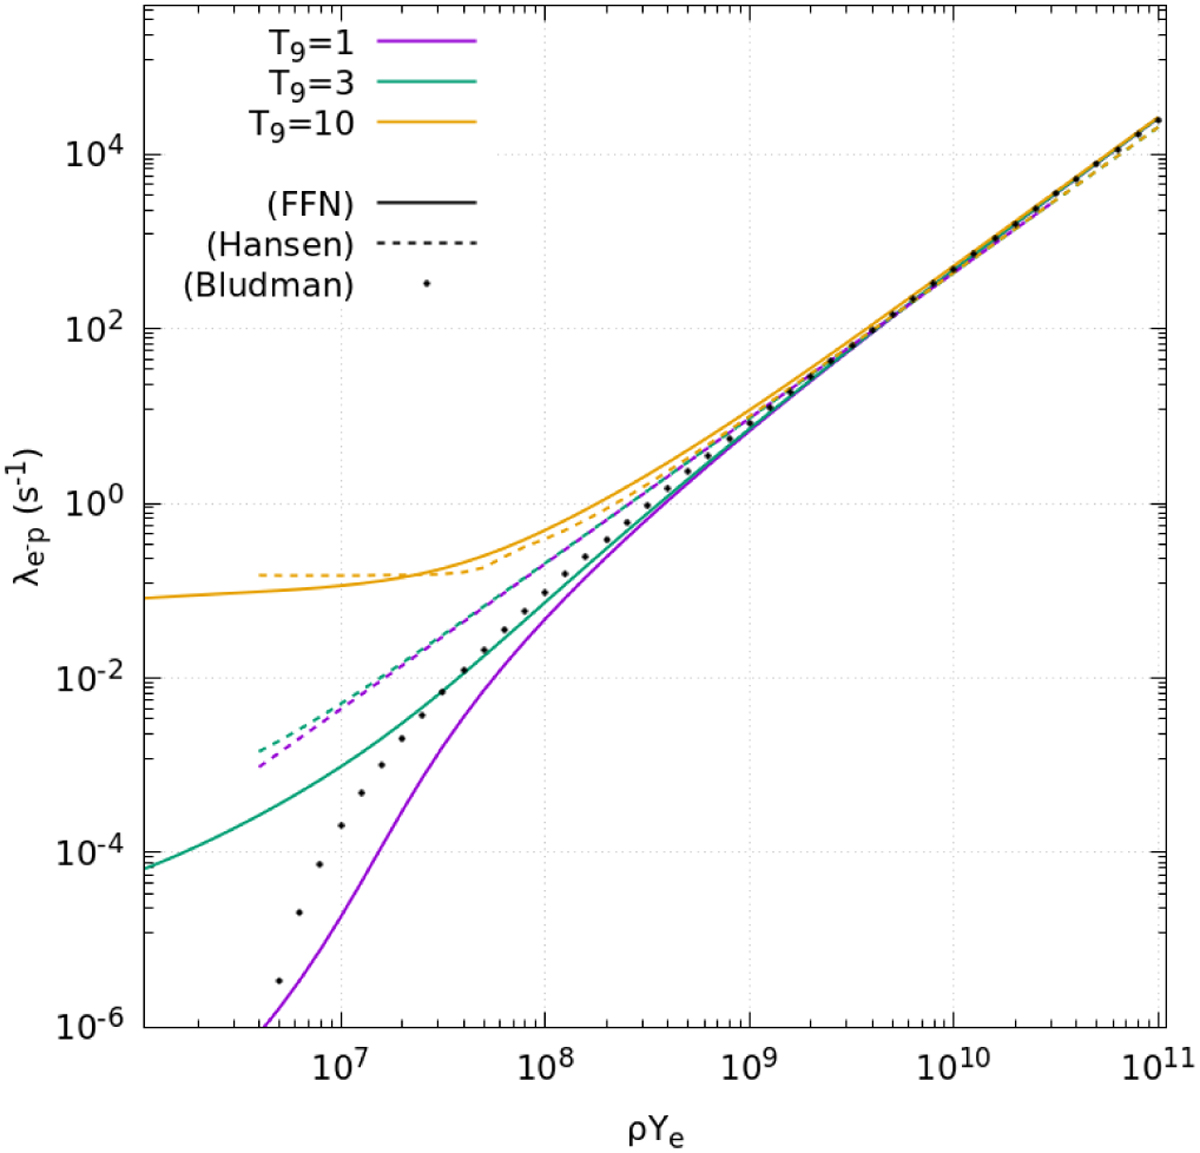
Fig. 2
Download original image
Comparison among e− capture rates at temperatures T9 = 1, 3, 10, and different values of ρYe. The rate obtained numerically with the exact formulation of FFN (solid lines, Fuller et al. 1982) is compared to those obtained with the analytical approach by Hansen (1968) (dashed lines) and the zero temperature limit rate by Bludman et al. (1982) (black dotted line).
Current usage metrics show cumulative count of Article Views (full-text article views including HTML views, PDF and ePub downloads, according to the available data) and Abstracts Views on Vision4Press platform.
Data correspond to usage on the plateform after 2015. The current usage metrics is available 48-96 hours after online publication and is updated daily on week days.
Initial download of the metrics may take a while.