Fig. 16
Download original image
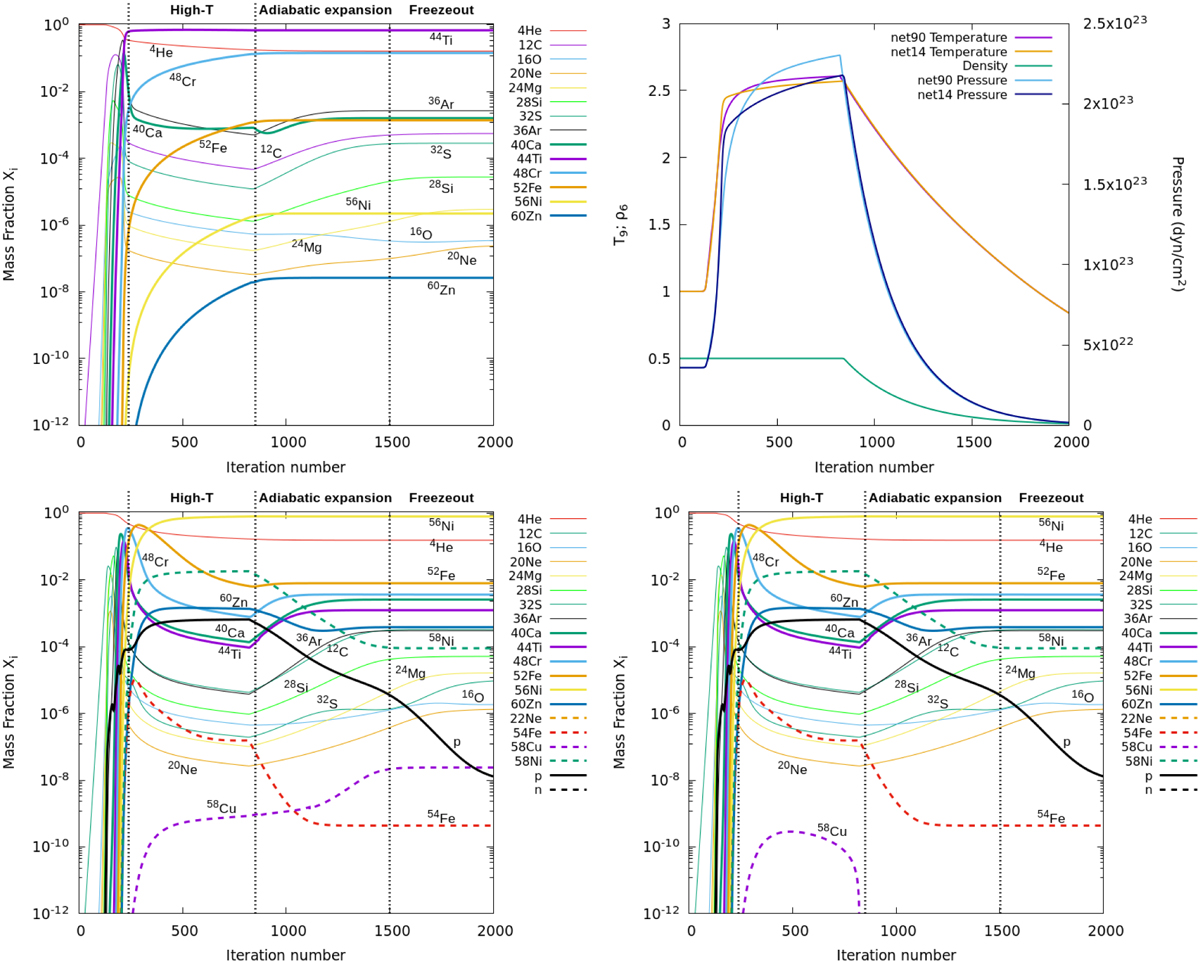
Results of the He test. Evolution of mass fractions obtained with net14 (top left), net90-noec (bottom left), and net90 (bottom right). Vertical dashed lines show the approximate limits of the high-temperature combustion region, when the artificial adiabatic expansion starts, and the region where nuclear reactions freezeout. The panel on the top right shows the evolution of temperature and pressure for net90 and net14. The calculation with net90-noec follows exactly the same trajectory as with net90 and is not shown. The density evolution is the same for all three nuclear networks.
Current usage metrics show cumulative count of Article Views (full-text article views including HTML views, PDF and ePub downloads, according to the available data) and Abstracts Views on Vision4Press platform.
Data correspond to usage on the plateform after 2015. The current usage metrics is available 48-96 hours after online publication and is updated daily on week days.
Initial download of the metrics may take a while.