Fig. 9.
Download original image
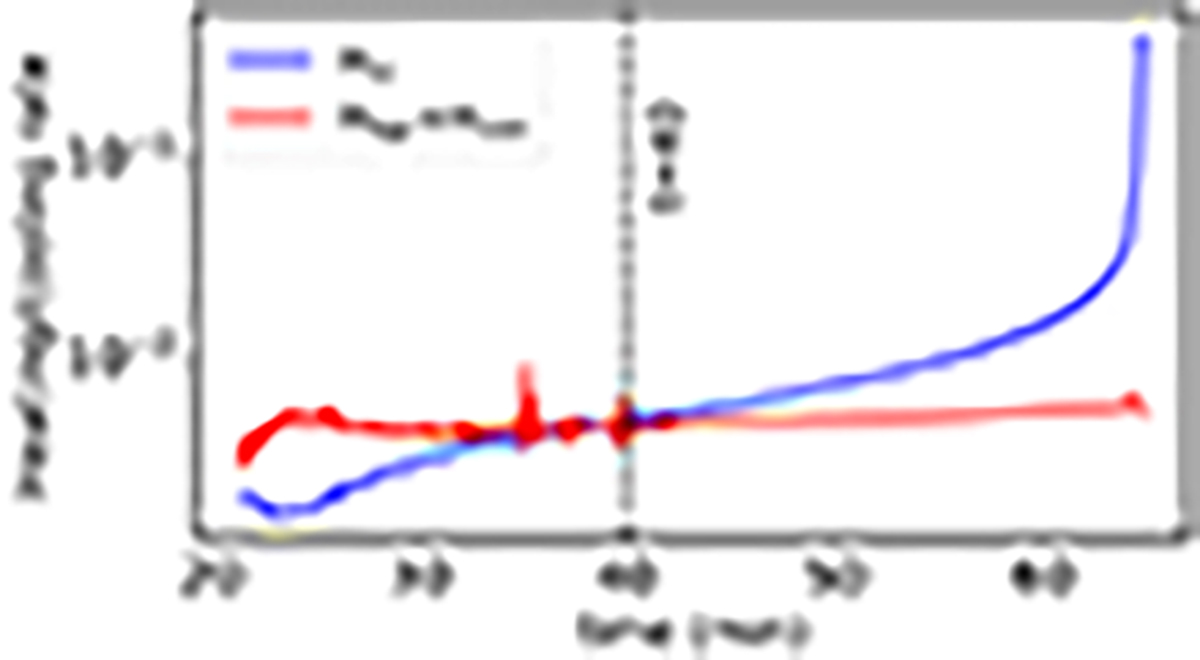
Development of a thermal imbalance between heating and cooling at the loop top location (x, y) = (3.14, 4) Mm in the late phase of our simulation. The red curve denotes the heating rate due to thermal conduction (Hcon) and background heat (Hbgr), and the blue curve denotes the cooling rate due to radiation (Hrc). The units for all the quantities are in erg cm−3 s−1. The vertical dashed line marks the time after which the radiative cooling starts to dominate the heating due to conduction and background heat.
Current usage metrics show cumulative count of Article Views (full-text article views including HTML views, PDF and ePub downloads, according to the available data) and Abstracts Views on Vision4Press platform.
Data correspond to usage on the plateform after 2015. The current usage metrics is available 48-96 hours after online publication and is updated daily on week days.
Initial download of the metrics may take a while.