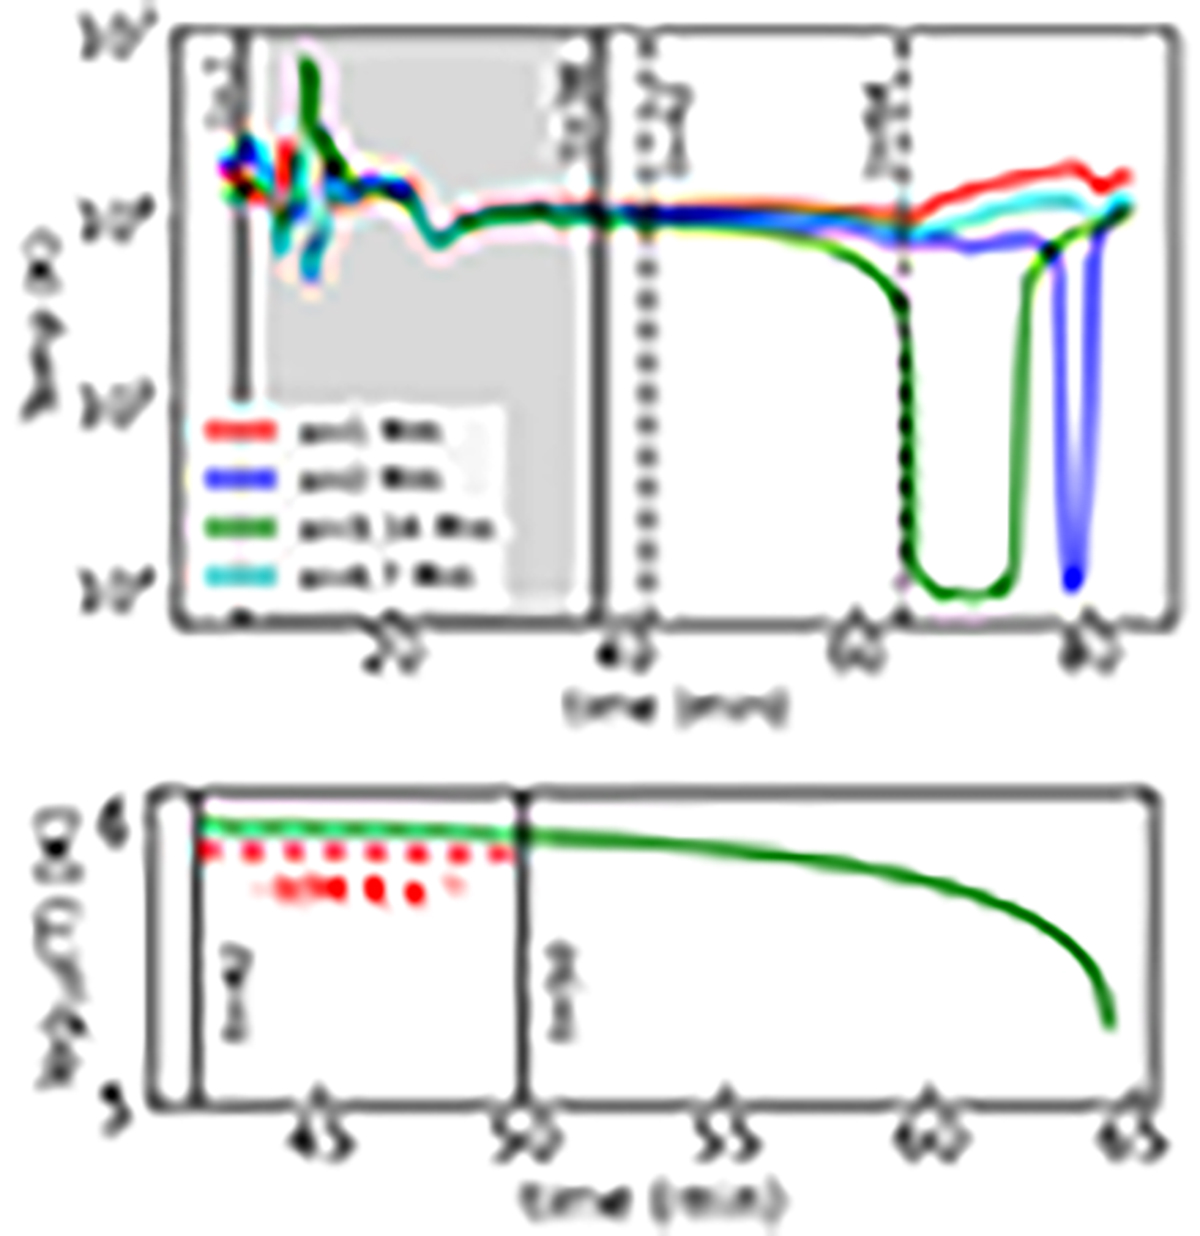
Fig. 8.
Download original image
Top panel: temperature evolution at four different horizontal locations at x = 1, 2, 3.14, and 4.7 Mm all at the same height y = 4 Mm. The shaded region between t = 7 to 38 min represents the eruption phase, where several MFRs leave the domain. The vertical dashed line at t = 42 min marks the time when the upper coronal part again settles down to around 1 MK. The dashed line at t = 64 min represents the onset of a thermal runaway process, which occurs first at the central x = 3.14 Mm location. Bottom panel: temperature evolution in the central (x, y) = (3.14, 4) Mm location. The temperature drops between t = 42 and 50 min with a decay rate of 156 K s−1, as represented by the dashed red line.
Current usage metrics show cumulative count of Article Views (full-text article views including HTML views, PDF and ePub downloads, according to the available data) and Abstracts Views on Vision4Press platform.
Data correspond to usage on the plateform after 2015. The current usage metrics is available 48-96 hours after online publication and is updated daily on week days.
Initial download of the metrics may take a while.