Fig. 6.
Download original image
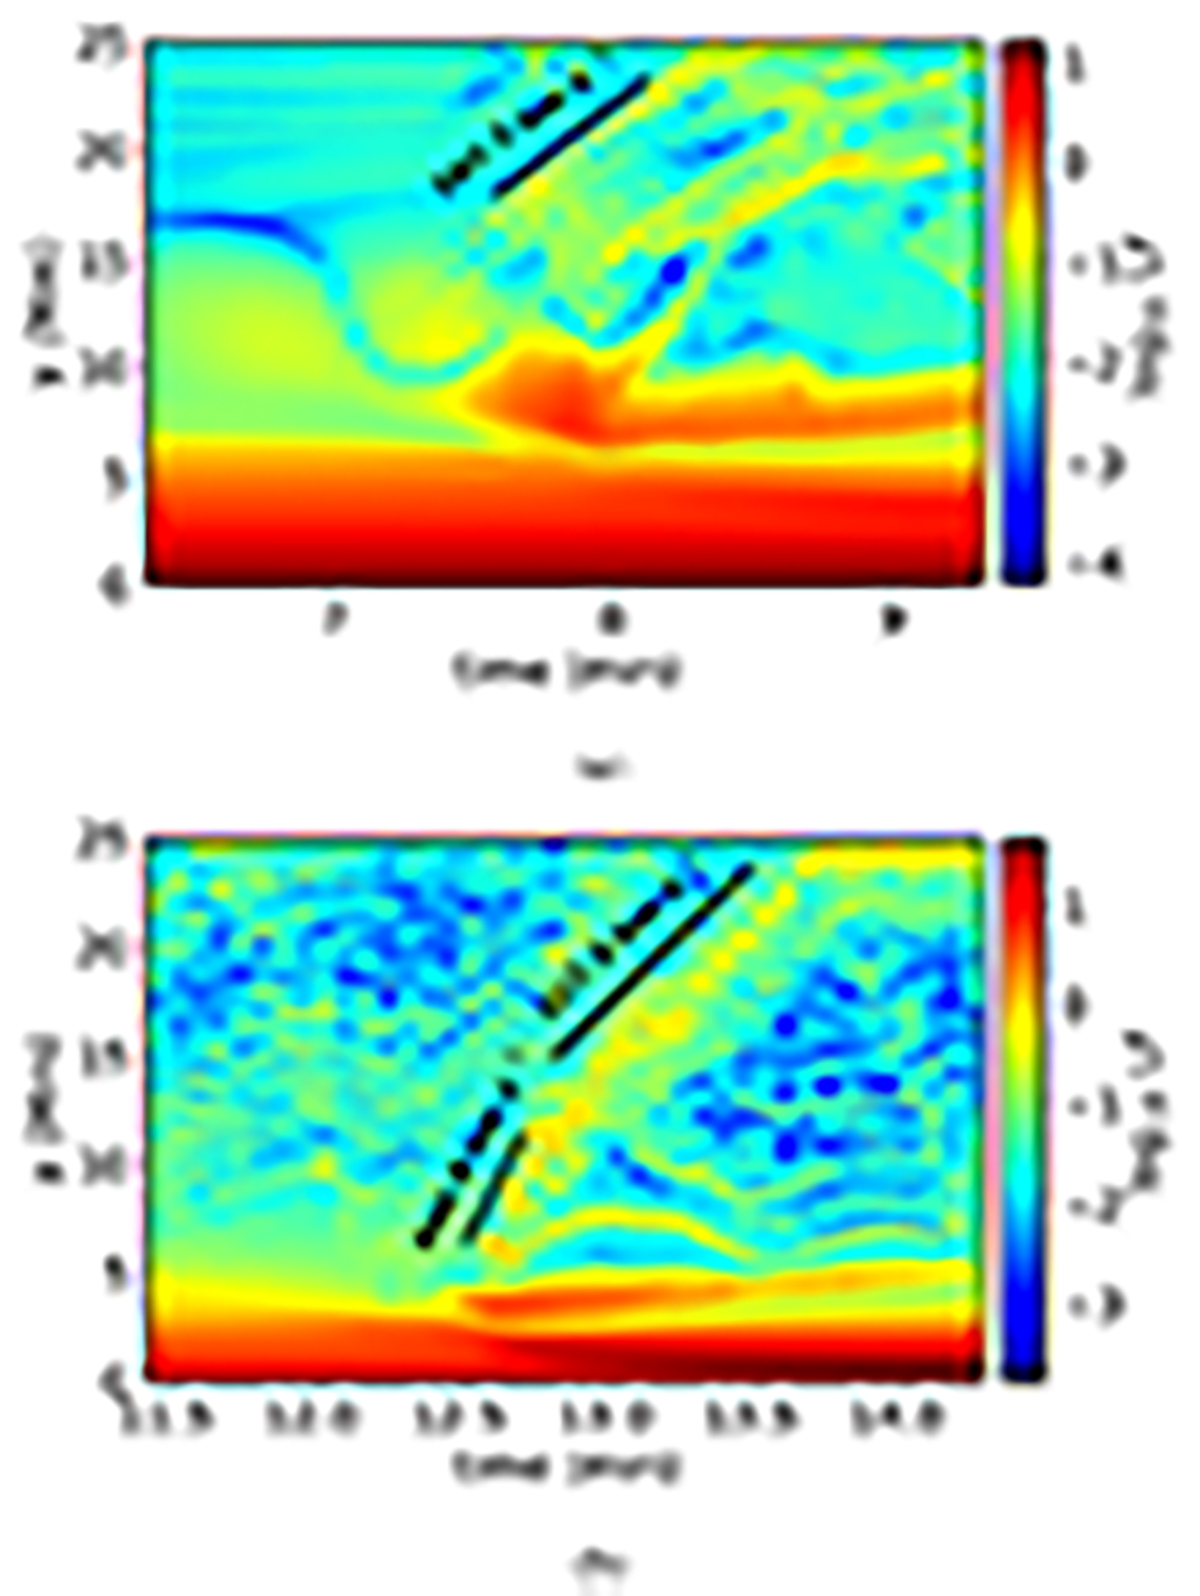
Time-distance map of LF (in arbitrary units) along the vertical cut at x = 3.14 Mm. Panels a and b represent the time domain around the first and second flux rope eruption phases, respectively. The slope(s) at the selected part(s) in the maps is highlighted by the black lines to estimate the eruption speed of the flux ropes.
Current usage metrics show cumulative count of Article Views (full-text article views including HTML views, PDF and ePub downloads, according to the available data) and Abstracts Views on Vision4Press platform.
Data correspond to usage on the plateform after 2015. The current usage metrics is available 48-96 hours after online publication and is updated daily on week days.
Initial download of the metrics may take a while.