Fig. 5.
Download original image
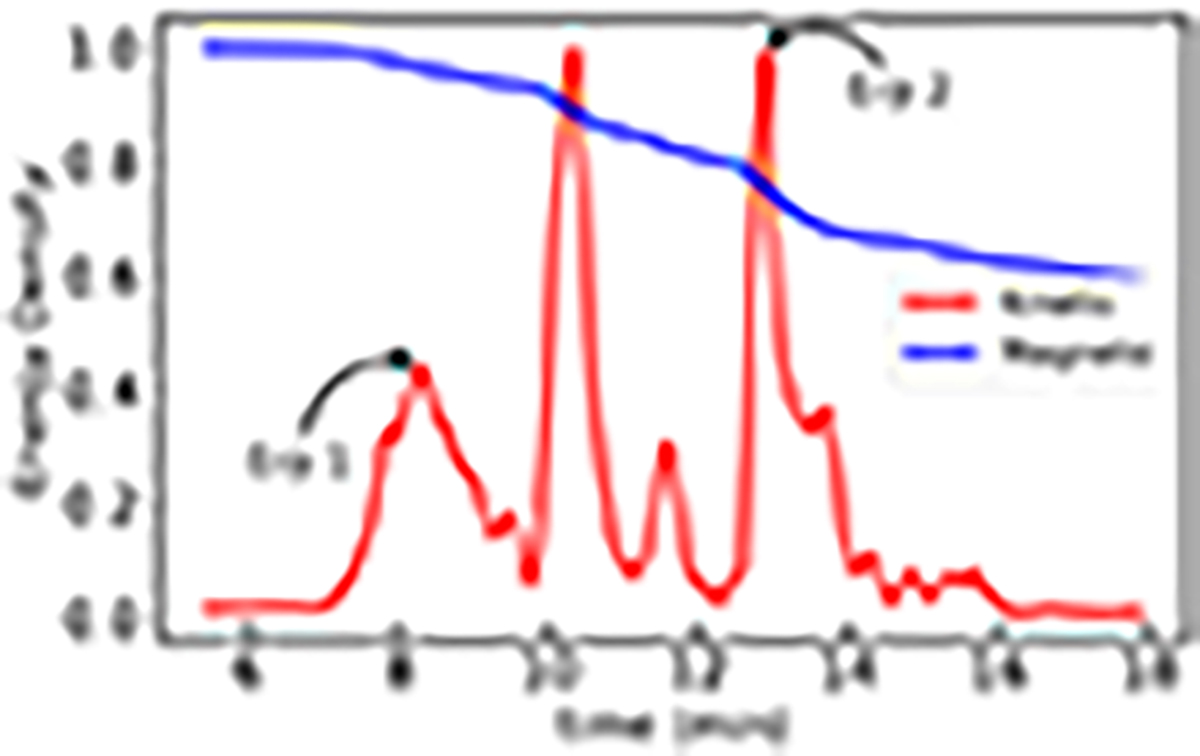
Temporal evolution of (normalized) mean kinetic and magnetic energy densities during the eruption phases, where the black arrows represent the time when first (Erp 1) and second (Erp 2) eruptions from the central region have their peak KE densities. The other peaks between the two eruptions (Erp 1 and 2) show the signature due to eruptions from the side boundaries.
Current usage metrics show cumulative count of Article Views (full-text article views including HTML views, PDF and ePub downloads, according to the available data) and Abstracts Views on Vision4Press platform.
Data correspond to usage on the plateform after 2015. The current usage metrics is available 48-96 hours after online publication and is updated daily on week days.
Initial download of the metrics may take a while.