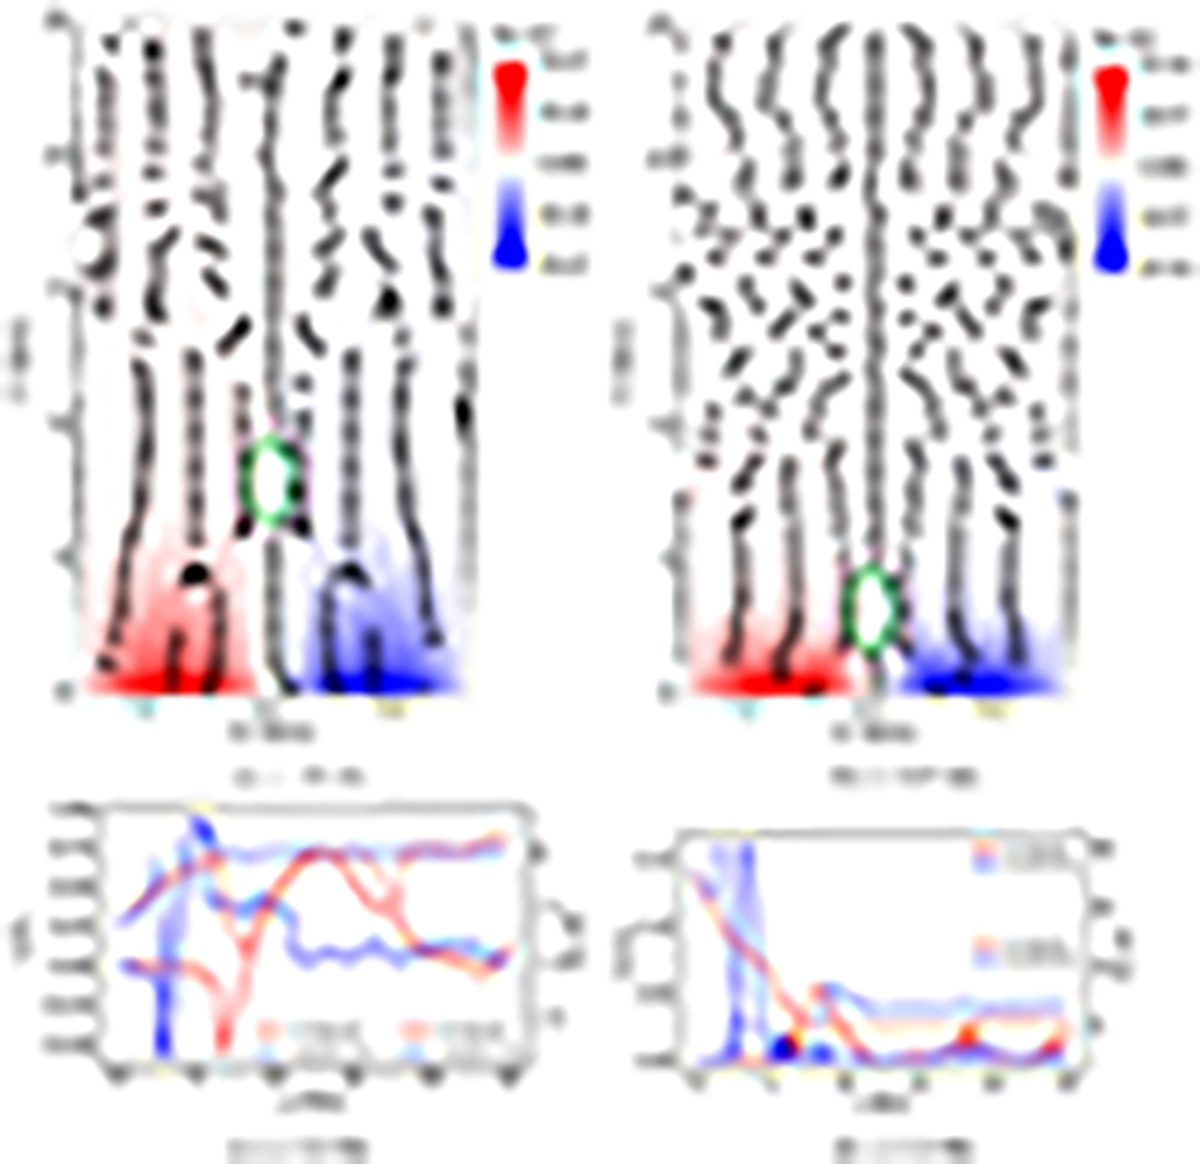
Fig. 4.
Download original image
Variation in the By field in the x − y plane shown at (a) t = 7.66 and (b) 12.67 min, where the overplotted black arrows represent the velocity field {vx, vy} in the x − y plane. The region inside the green ellipses (in panels a and b) contain the location of the reconnection points, where the plasma flows in and out due to reconnection (the height and width aspect ratio in the figures are not to scale). (c) vy and By distributions along y-direction at x = 3.14 Mm (which covers the location of the reconnection point). (d) Absolute velocity of the vx and Bx distributions in the y-direction at x = 3.14 Mm for the eruption phases. The velocities are scaled in units of instantaneous Alfvén speed (va). The solid and dashed curves in panels c and d represent the velocities and magnetic field strengths, respectively.
Current usage metrics show cumulative count of Article Views (full-text article views including HTML views, PDF and ePub downloads, according to the available data) and Abstracts Views on Vision4Press platform.
Data correspond to usage on the plateform after 2015. The current usage metrics is available 48-96 hours after online publication and is updated daily on week days.
Initial download of the metrics may take a while.