Fig. 3.
Download original image
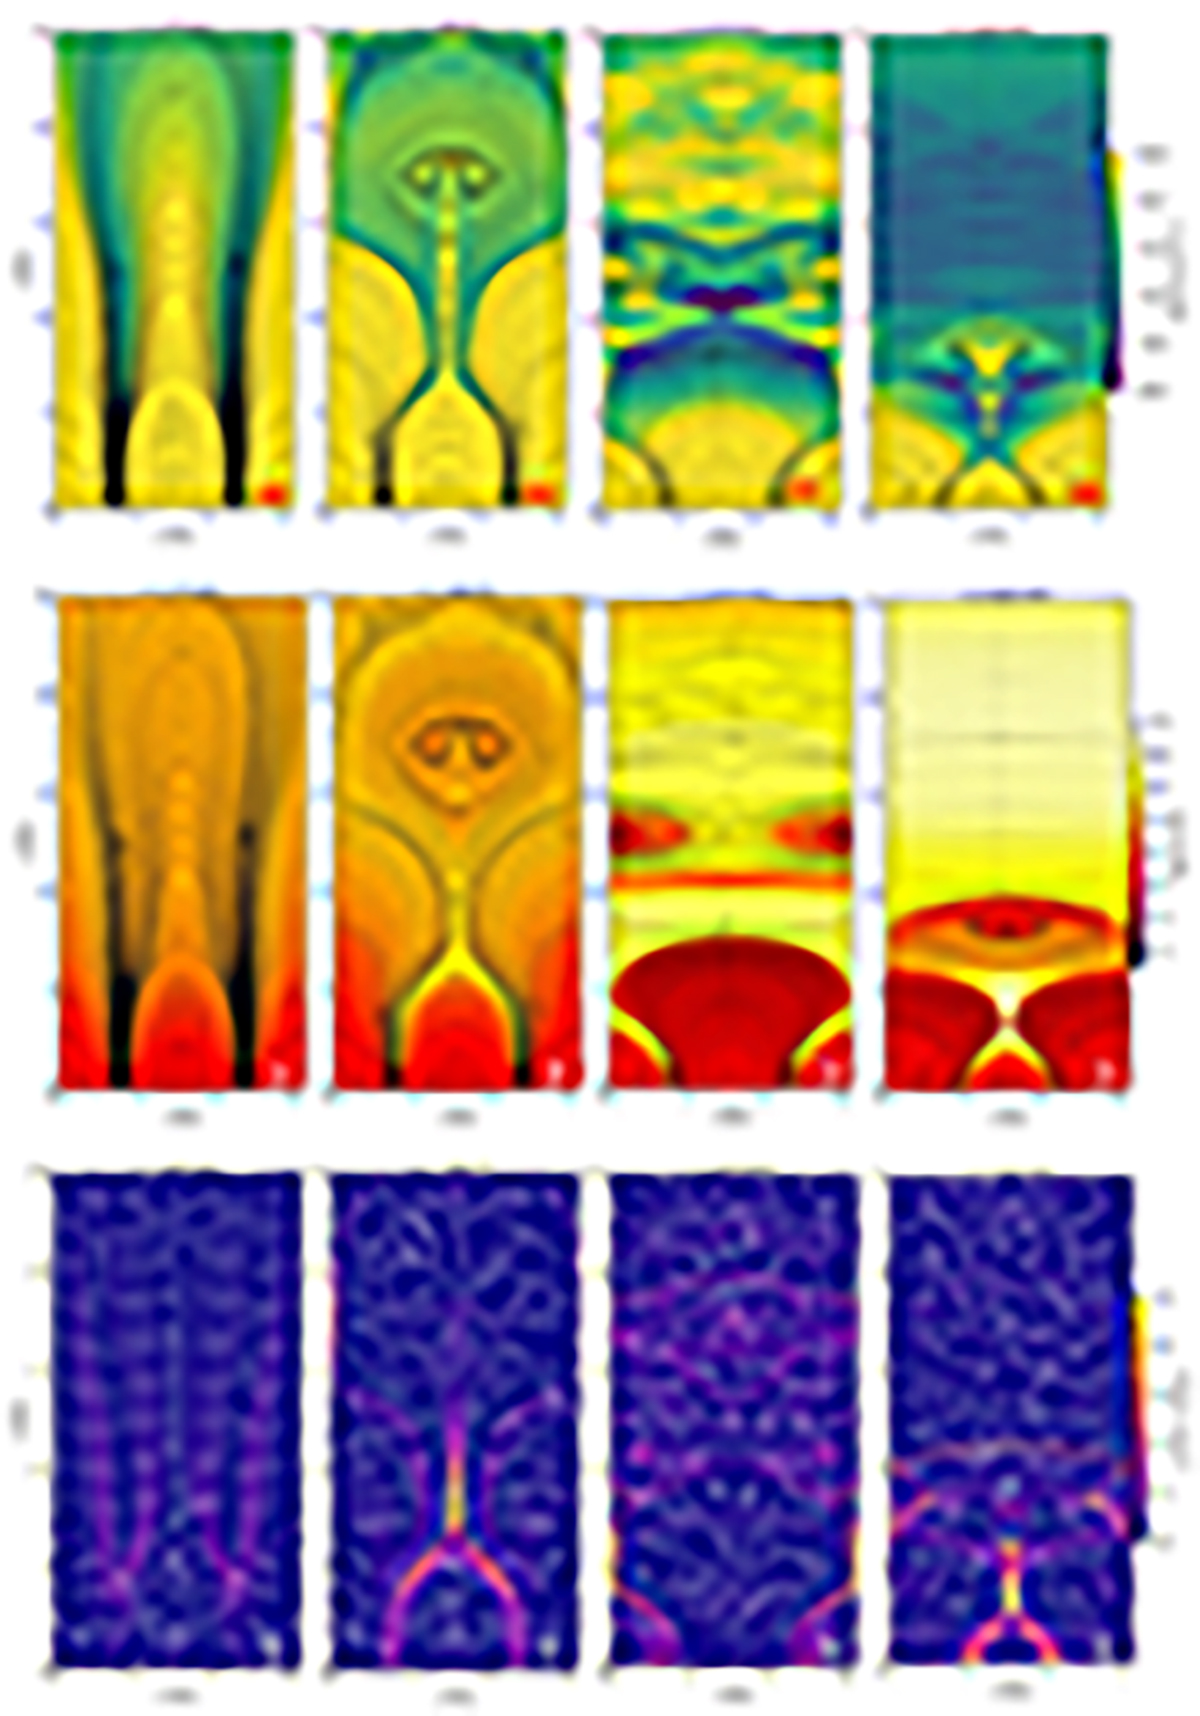
Top row: spatial distribution of the plasma density for (a) the semi-equilibrium stage. Panels b–d show the different MFR eruption stages, where the overplotted solid curves represent the MFLs projected in the x − y plane. Middle row: same as in the top panel for temperature. Bottom row: distribution of the LF over the entire simulation domain, where the overplotted arrows represent the LF direction in the x − y plane. The saturation level of the color bar is taken up to 10−5 G2 cm−1 for a better visualization of the enhanced LF regions. Animations of the figures are available online (the height and width aspect ratio of the figures are not to scale).
Current usage metrics show cumulative count of Article Views (full-text article views including HTML views, PDF and ePub downloads, according to the available data) and Abstracts Views on Vision4Press platform.
Data correspond to usage on the plateform after 2015. The current usage metrics is available 48-96 hours after online publication and is updated daily on week days.
Initial download of the metrics may take a while.