Open Access
Fig. A.1.
Download original image
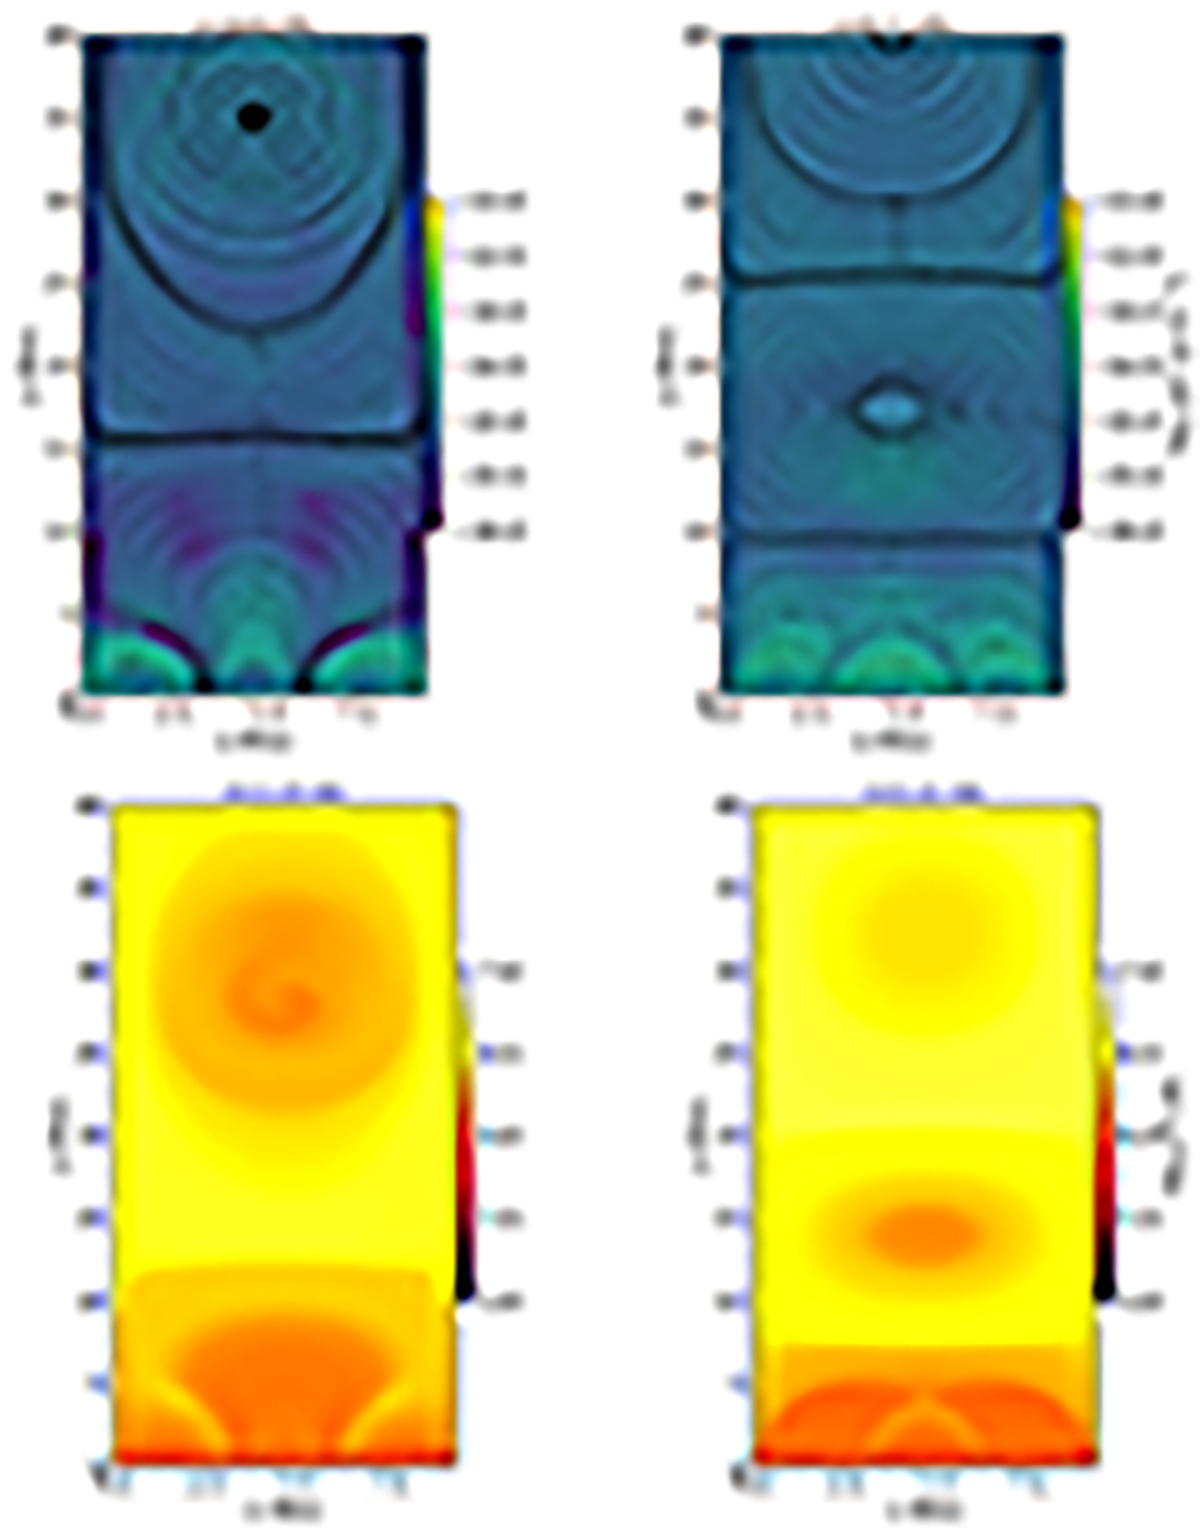
Spatial distribution of the plasma density (top panel) and temperature (bottom panel) for t = 13.23, and 21.11 min. The overplotted solid curves represent the MFLs projected in the x − y plane (height and width aspect ratio of the figures are not to scale).
Current usage metrics show cumulative count of Article Views (full-text article views including HTML views, PDF and ePub downloads, according to the available data) and Abstracts Views on Vision4Press platform.
Data correspond to usage on the plateform after 2015. The current usage metrics is available 48-96 hours after online publication and is updated daily on week days.
Initial download of the metrics may take a while.