Open Access
Fig. 12.
Download original image
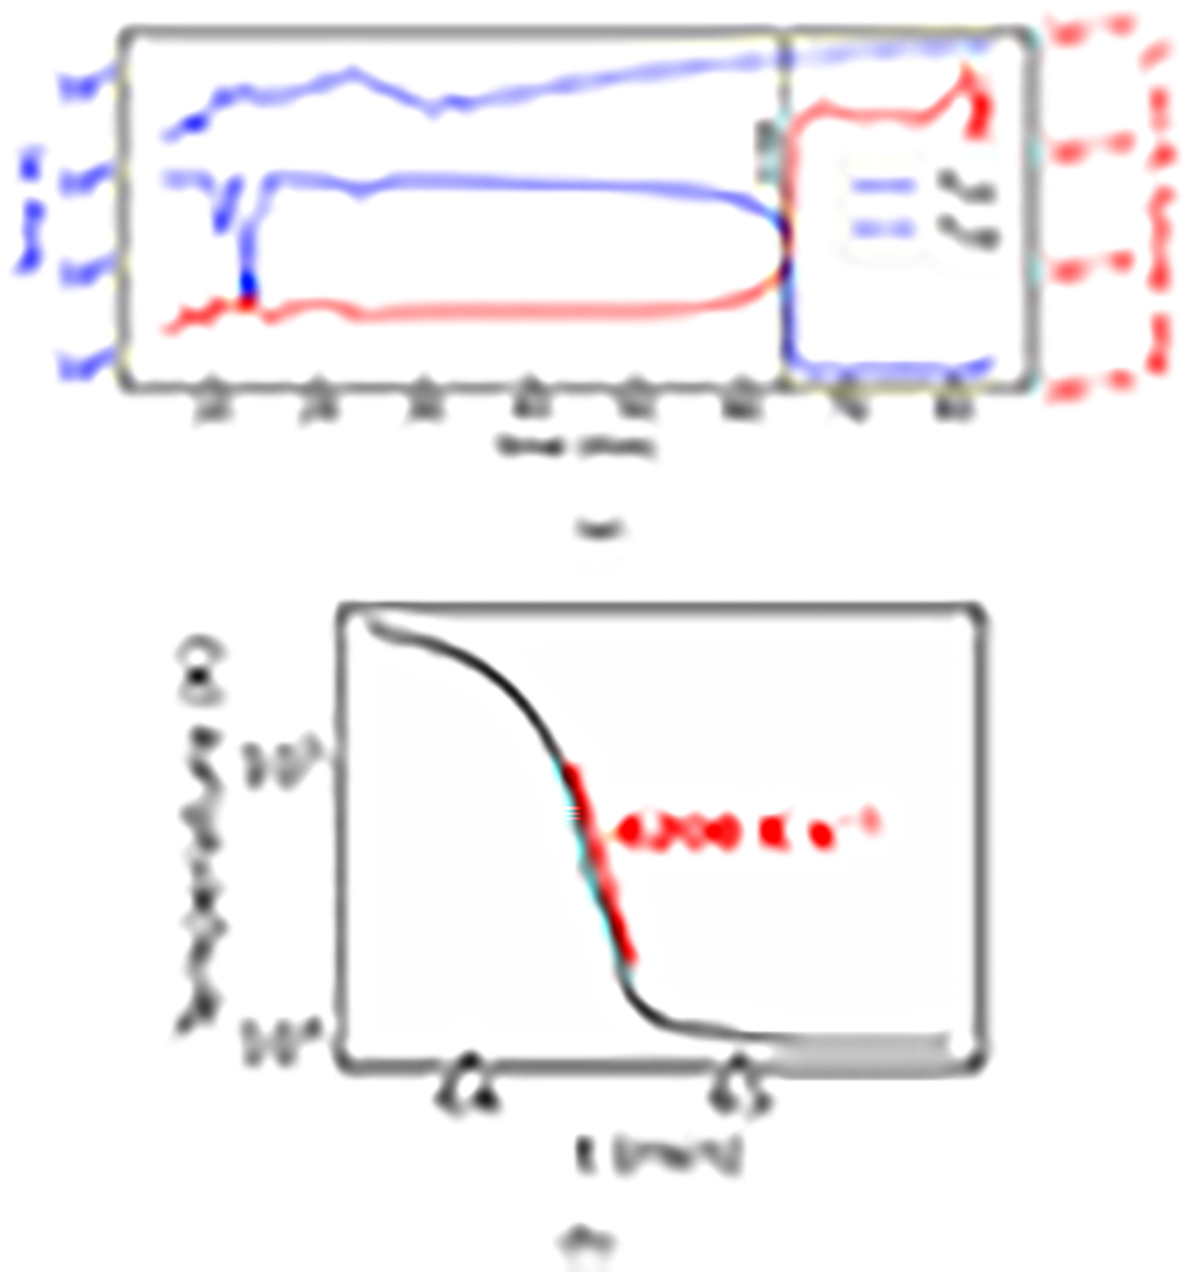
(a) Time series of the instantaneous maximum and minimum temperature, and peak density. Panel b represents the temporal variation in the instantaneous minimum temperature, highlighting the catastrophic cooling phase, where the maximum cooling rate is estimated by the slope ≈ − 6200 K s−1 that is marked by the red line.
Current usage metrics show cumulative count of Article Views (full-text article views including HTML views, PDF and ePub downloads, according to the available data) and Abstracts Views on Vision4Press platform.
Data correspond to usage on the plateform after 2015. The current usage metrics is available 48-96 hours after online publication and is updated daily on week days.
Initial download of the metrics may take a while.