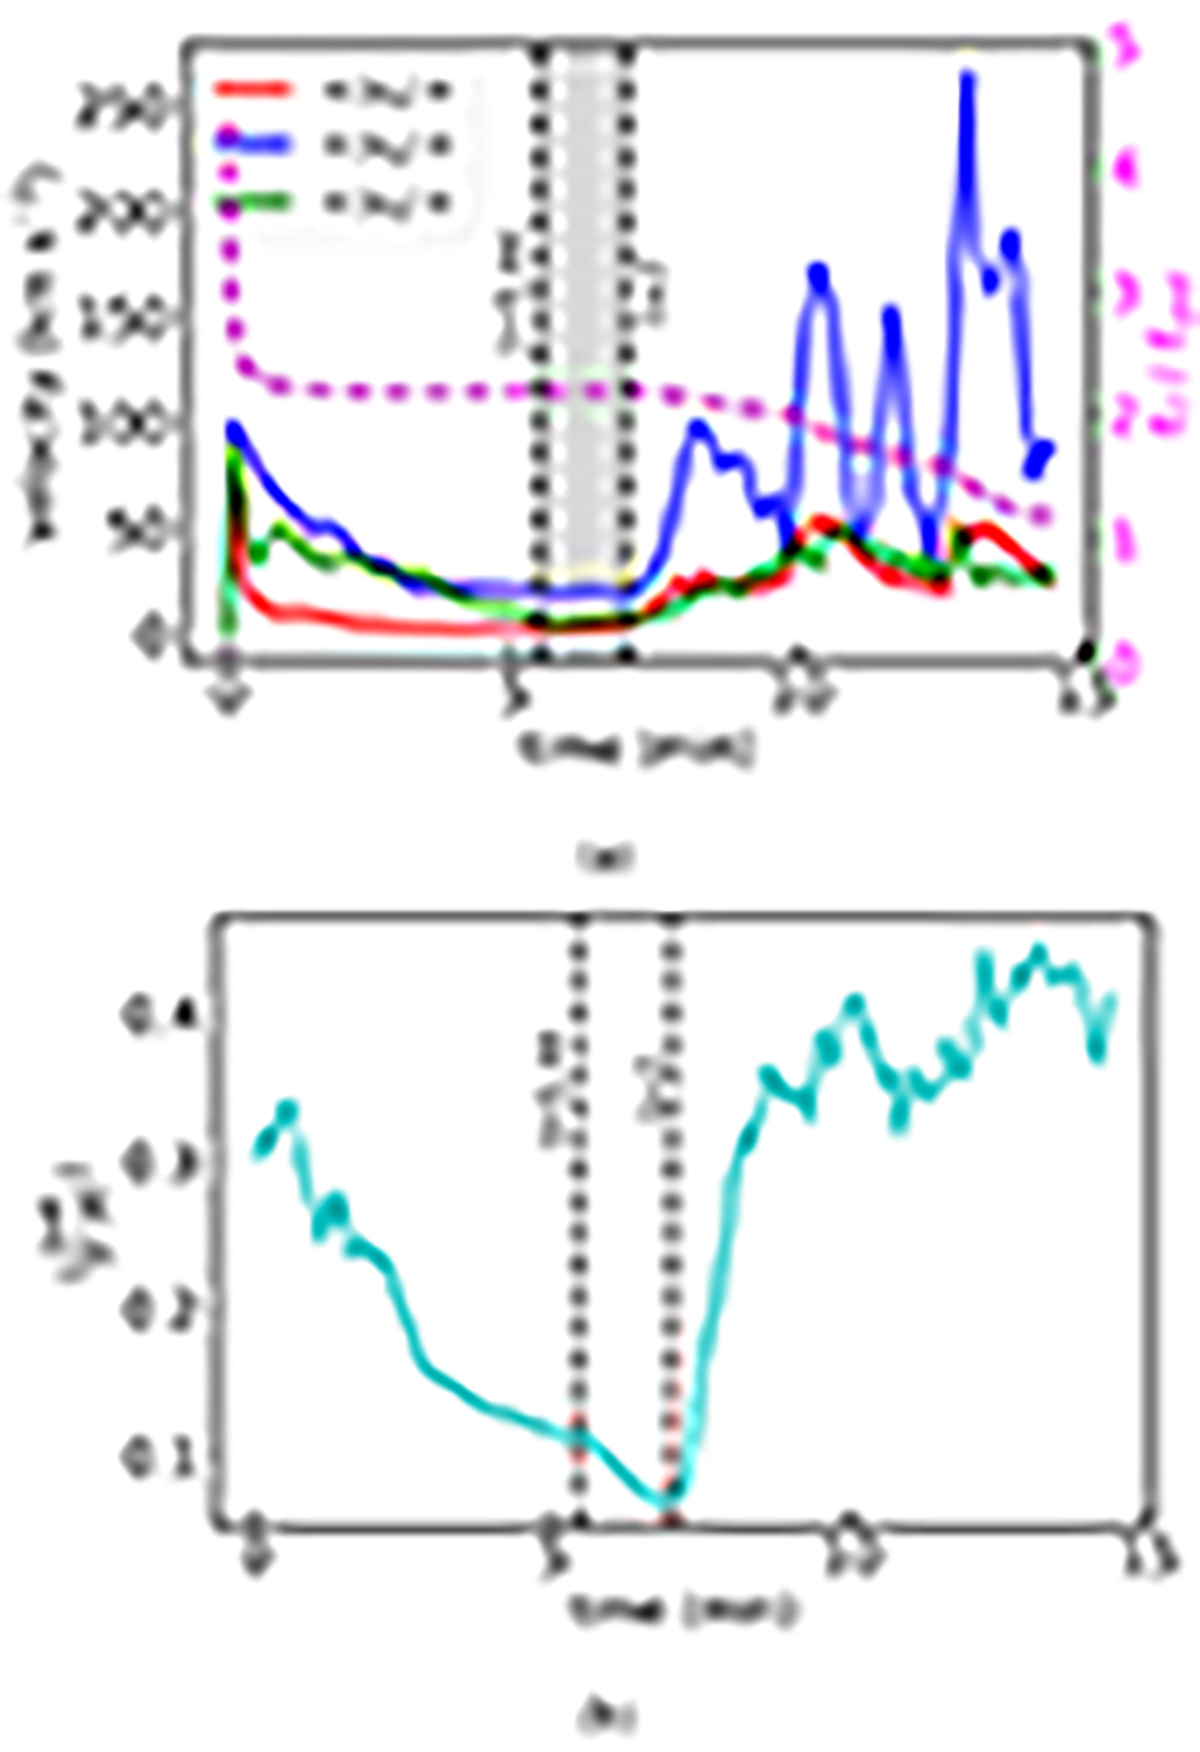
Fig. 1.
Download original image
Temporal evolution of (a) the spatially averaged absolute velocity components ⟨|vx(t)|⟩, ⟨|vy(t)|⟩, ⟨|vz(t)|⟩ and the ratio of free (Ef) to potential (Epot) energy (dashed magenta curve). The shaded region between t = 5.44 and 7 min (shown by two vertical dashed lines) represents the dynamical semi-equilibrium phase of the system, where ⟨|vy(t)|⟩≈19 km s−1, ⟨|vx(t)|⟩≈2.2 km s−1, ⟨|vz(t)|⟩≈5.4 km s−1, and Ef/Epot ≈ 2.1; and (b) the spatial average, ![]() .
.
Current usage metrics show cumulative count of Article Views (full-text article views including HTML views, PDF and ePub downloads, according to the available data) and Abstracts Views on Vision4Press platform.
Data correspond to usage on the plateform after 2015. The current usage metrics is available 48-96 hours after online publication and is updated daily on week days.
Initial download of the metrics may take a while.