Fig. 5
Download original image
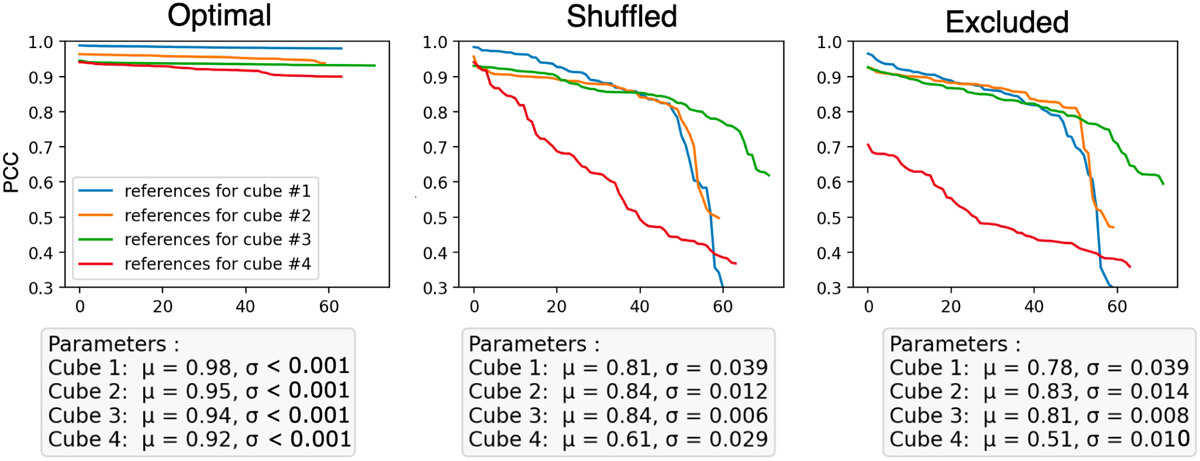
Pearson correlation coefficient of the selected reference frames computed individually and averaged over each frame of the raw ADI data before the injection of simulated disks or planets, for three different selections of references: (left) optimal references selected; (middle) a random sample of each cube’s dedicated references, including the optimal references, in an even proportion; and (right) a random sample of references excluding the optimal references. These coefficients were calculated within an annulus with an outer radius of 60 pixels and inner radius of 30 pixels, and are classified from the most correlated to the least correlated. The text box below each figure displays the mean PCC (μ) and the variance (σ) of the reference sample relative to its associated data cube.
Current usage metrics show cumulative count of Article Views (full-text article views including HTML views, PDF and ePub downloads, according to the available data) and Abstracts Views on Vision4Press platform.
Data correspond to usage on the plateform after 2015. The current usage metrics is available 48-96 hours after online publication and is updated daily on week days.
Initial download of the metrics may take a while.