Fig. 4
Download original image
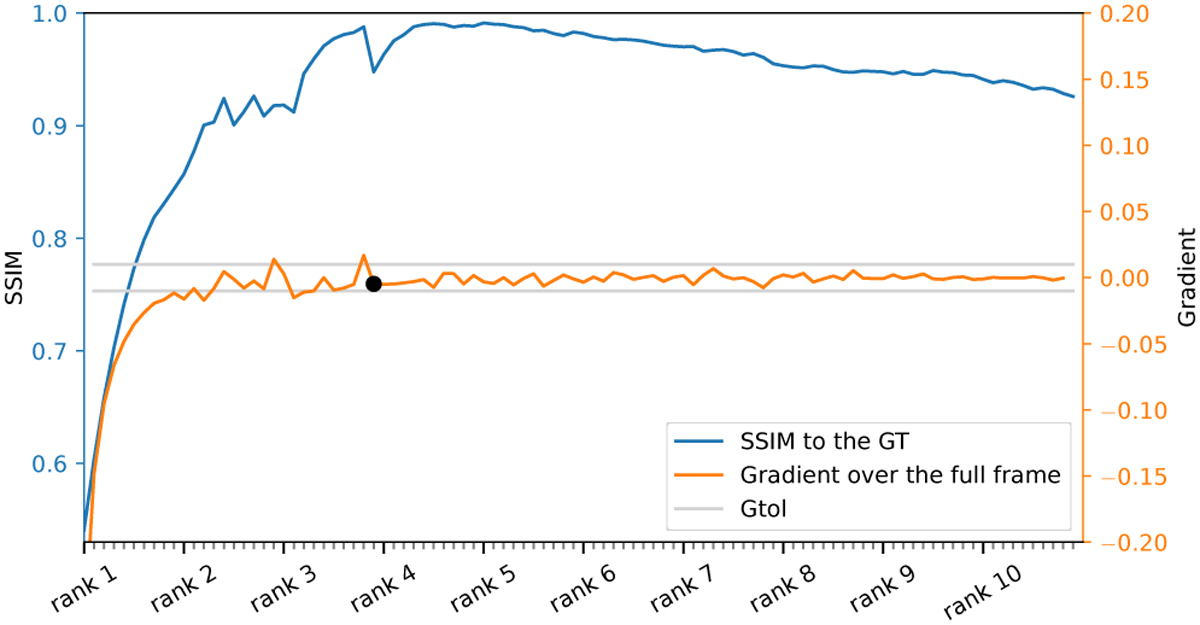
Evolution of the IPCA with ARDI estimate through the iterations, using the same dataset as in Fig. 3. The blue curve relates to the left y-axis and displays the value of the SSIM for each estimate. The orange curve relates to the right y-axis and represents the gradient computed over the full frame, as described in Eq. (4). The gtol has been set to 10−2 and is represented on the figure by the two gray lines. The black dot indicates the iteration where the gradient curve reaches the gtol and does not exceed it in further steps. The x-axis represents each iteration, where the minor ticks represent a single iteration, and the major ticks represent a rank update.
Current usage metrics show cumulative count of Article Views (full-text article views including HTML views, PDF and ePub downloads, according to the available data) and Abstracts Views on Vision4Press platform.
Data correspond to usage on the plateform after 2015. The current usage metrics is available 48-96 hours after online publication and is updated daily on week days.
Initial download of the metrics may take a while.