Fig. 1
Download original image
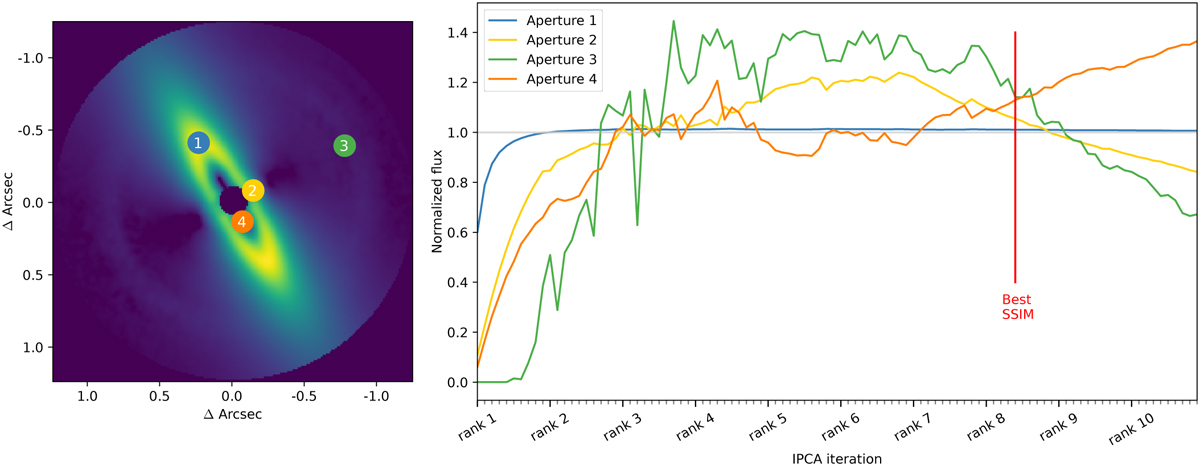
Best disk image, according to the SSIM metric, obtained with the IPCA algorithm leveraging ADI only while processing a synthetic dataset (disk#B, cube #3 at a contrast of 10−3; see Sec. 4). The image on the left displays different apertures placed on (1) the brightest part of the disk, (2) a region of the disk that is rotation invariant, (3) a noise region, and (4) the region near the coronagraphic region where the variation of the speckle field is higher. On the right-hand side, we plot the evolution of the integrated flux computed in these different apertures through the IPCA iterations. The red vertical line indicates the position of the best image among all iterations according to SSIM. Each curve in the figure is normalized by its mean. The x-axis represents each iteration of the IPCA process, starting at rank 1, up to rank 10, with 10 iterations per rank. The gray horizontal line, placed at y = 1, indicates the position where the flux is equal to its mean.
Current usage metrics show cumulative count of Article Views (full-text article views including HTML views, PDF and ePub downloads, according to the available data) and Abstracts Views on Vision4Press platform.
Data correspond to usage on the plateform after 2015. The current usage metrics is available 48-96 hours after online publication and is updated daily on week days.
Initial download of the metrics may take a while.