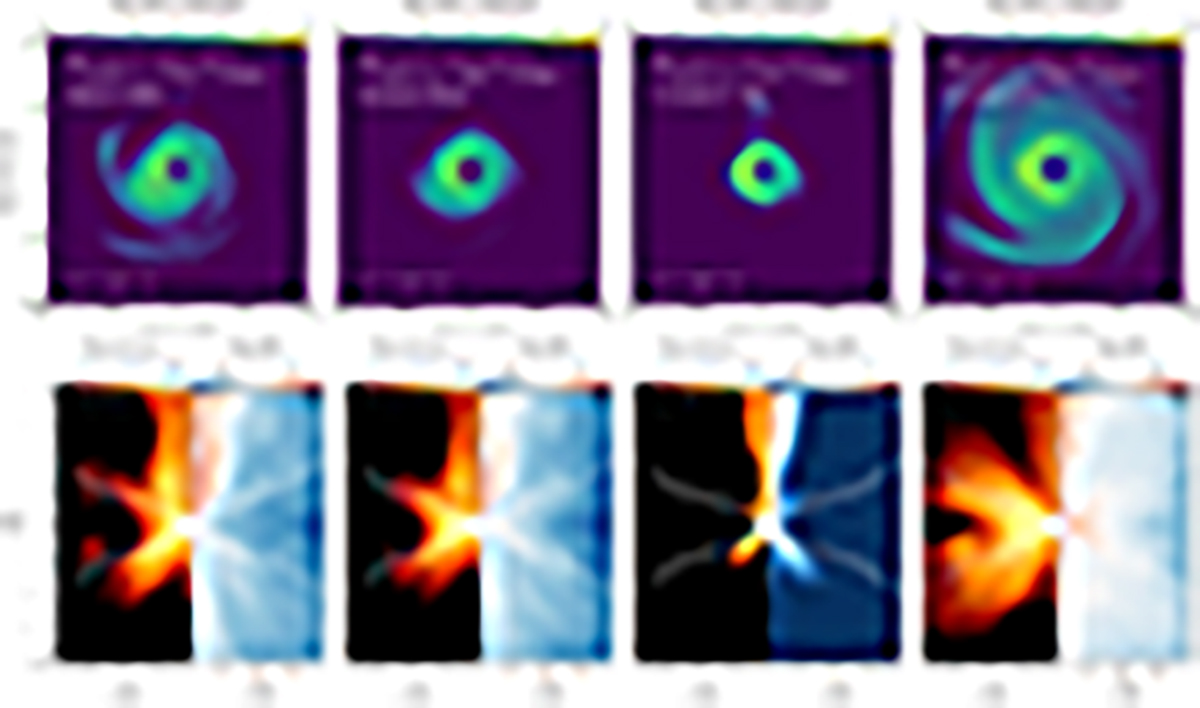
Fig. 9.
Download original image
GRRT images and corresponding emissivity and electron temperature distributions. First row: GRRT snapshot images for Sgr A* with inclination angle i = 30° at t = 12 240 M from (a) the turbulence heating model, (b) reconnection heating model, (c) R-β model with Rh = 160, and (d) R-β model with Rh = 1. Second row: Corresponding 230 GHz emissivity (left) and electron temperature (right) distributions. The solid white contours in panels (e)–(h) represent the edge of the torus, which is the ρ = 0.01 contour. The dashed contour represents the high magnetization region with σ > 1, which is cutoff in GRRT post-process.
Current usage metrics show cumulative count of Article Views (full-text article views including HTML views, PDF and ePub downloads, according to the available data) and Abstracts Views on Vision4Press platform.
Data correspond to usage on the plateform after 2015. The current usage metrics is available 48-96 hours after online publication and is updated daily on week days.
Initial download of the metrics may take a while.