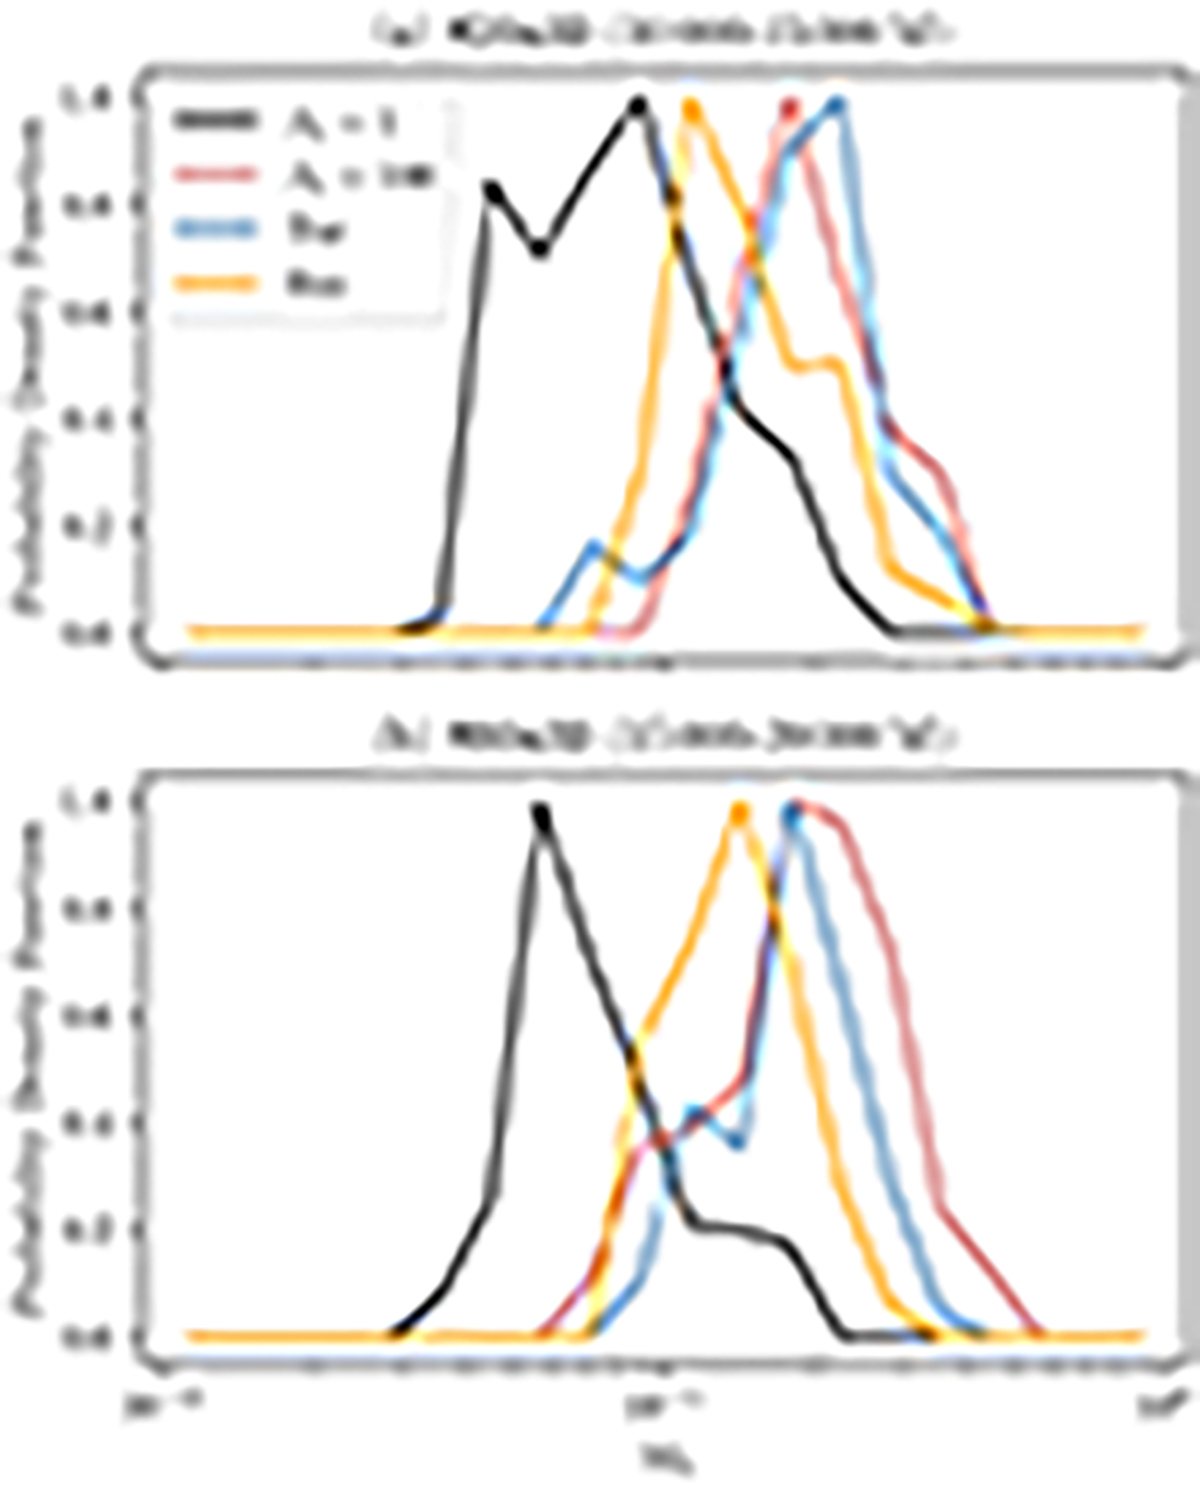
Fig. 8.
Download original image
Probability distribution function of the M3 of the light curves generated from M20a3D (a) and M80a3D (b). The probability distribution functions have been normalized by setting the peak value to one. The black and red lines represent the cases with different Rh values from the R-β model. The blue and yellow lines are from turbulence and reconnection models, respectively.
Current usage metrics show cumulative count of Article Views (full-text article views including HTML views, PDF and ePub downloads, according to the available data) and Abstracts Views on Vision4Press platform.
Data correspond to usage on the plateform after 2015. The current usage metrics is available 48-96 hours after online publication and is updated daily on week days.
Initial download of the metrics may take a while.