Fig. 5.
Download original image
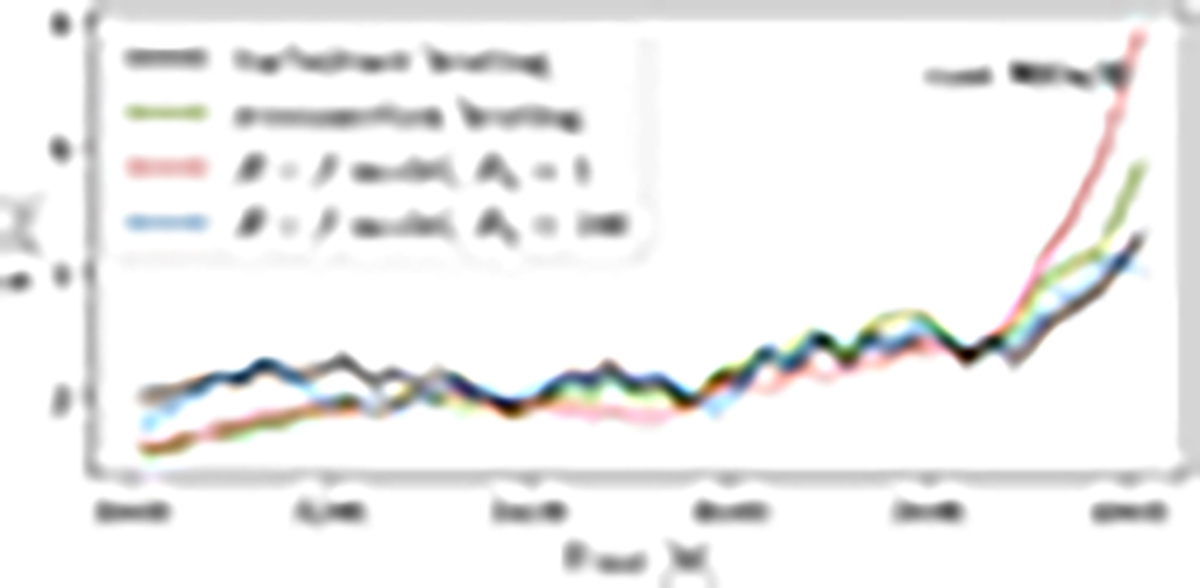
Evolution of light curves at 230 GHz for the case of M80a3D with different heating models and R-β models. The black solid line represents the light curve from the turbulence heating model. The blue solid line is the reconnection heating one. The red and dark-green lines represent the R-β models with Rh equals 1 and 160, respectively.
Current usage metrics show cumulative count of Article Views (full-text article views including HTML views, PDF and ePub downloads, according to the available data) and Abstracts Views on Vision4Press platform.
Data correspond to usage on the plateform after 2015. The current usage metrics is available 48-96 hours after online publication and is updated daily on week days.
Initial download of the metrics may take a while.