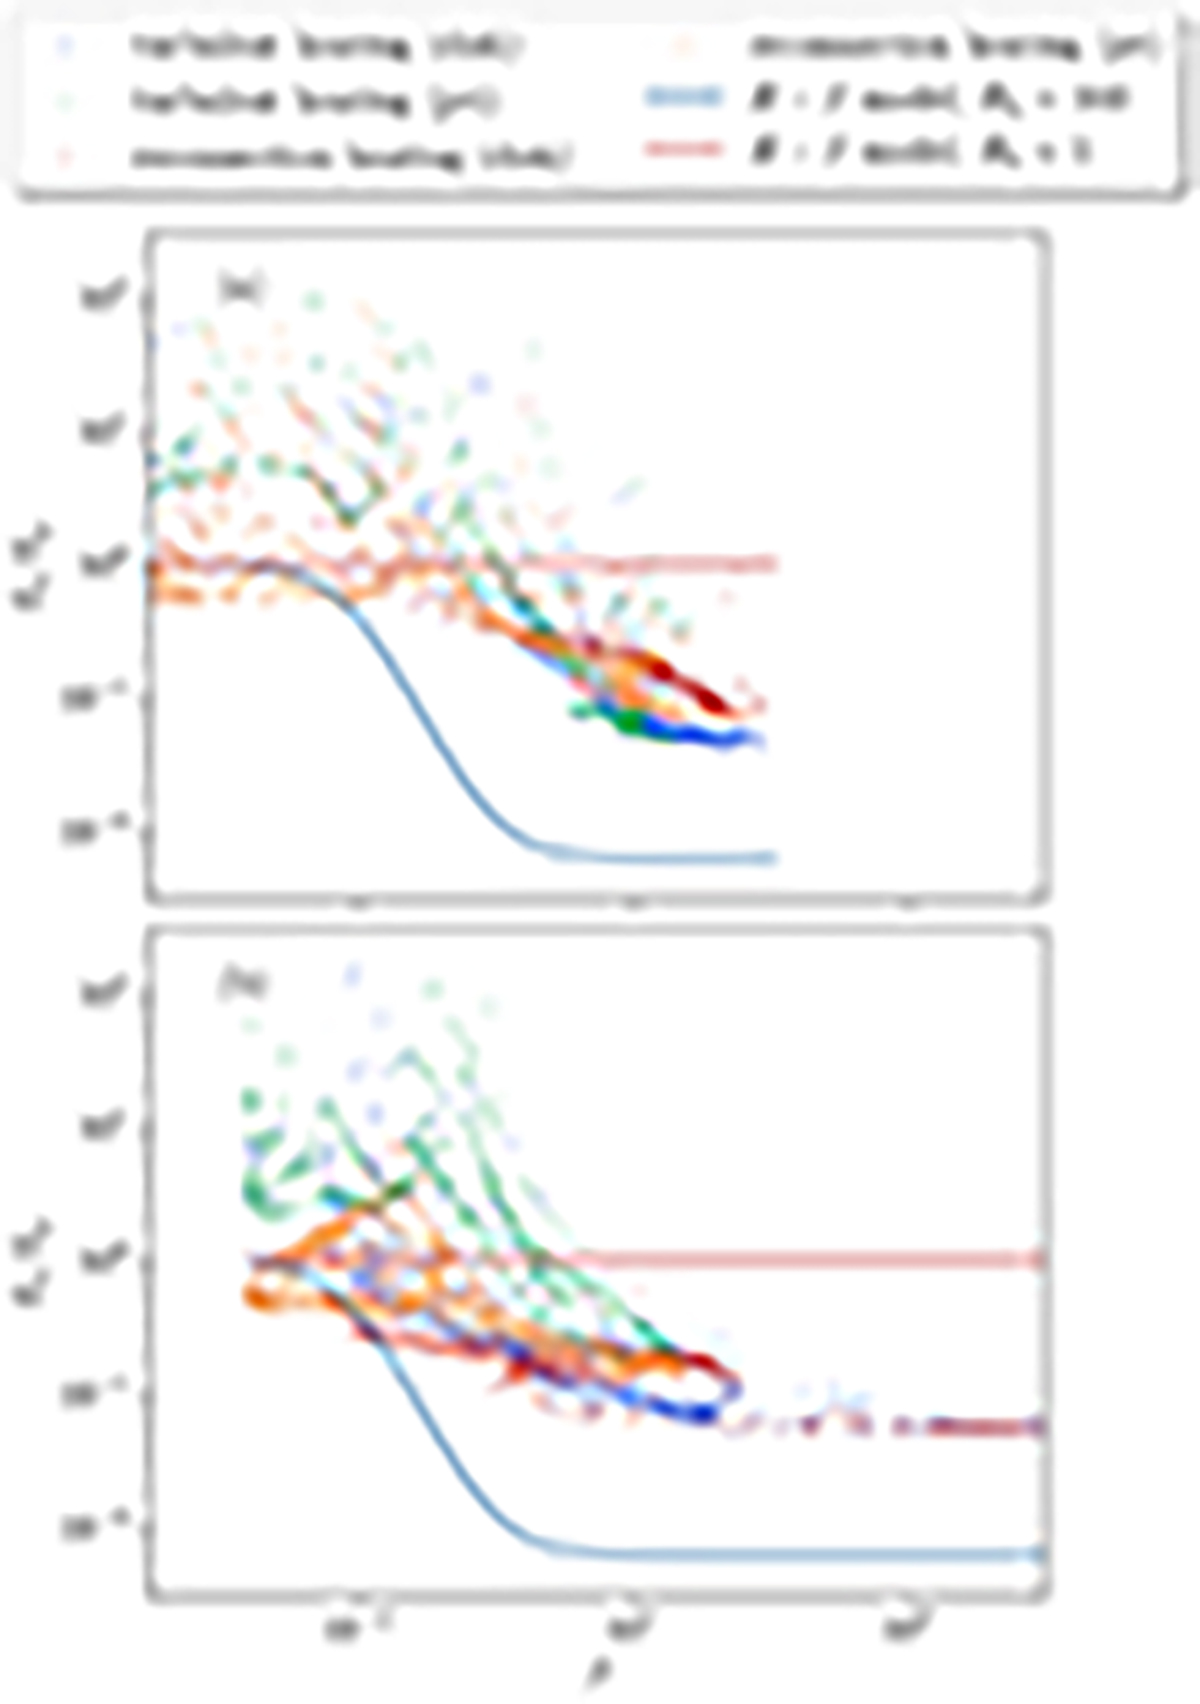
Fig. A.1.
Download original image
Te/Tp − β diagram of the average of collapse data from 15, 000 to 20,000 M of M80a3D (a) and from 10, 000 to 15,000 M of case M20a3D (b). Different colors mark the jet and disk components as well as the turbulence and reconnection heating models. The jet and disk are divided with criteria of magnetization σ > 1. The red and blue lines represent the R-β model with Rh = 1 and 160, respectively.
Current usage metrics show cumulative count of Article Views (full-text article views including HTML views, PDF and ePub downloads, according to the available data) and Abstracts Views on Vision4Press platform.
Data correspond to usage on the plateform after 2015. The current usage metrics is available 48-96 hours after online publication and is updated daily on week days.
Initial download of the metrics may take a while.