Open Access
Fig. 12.
Download original image
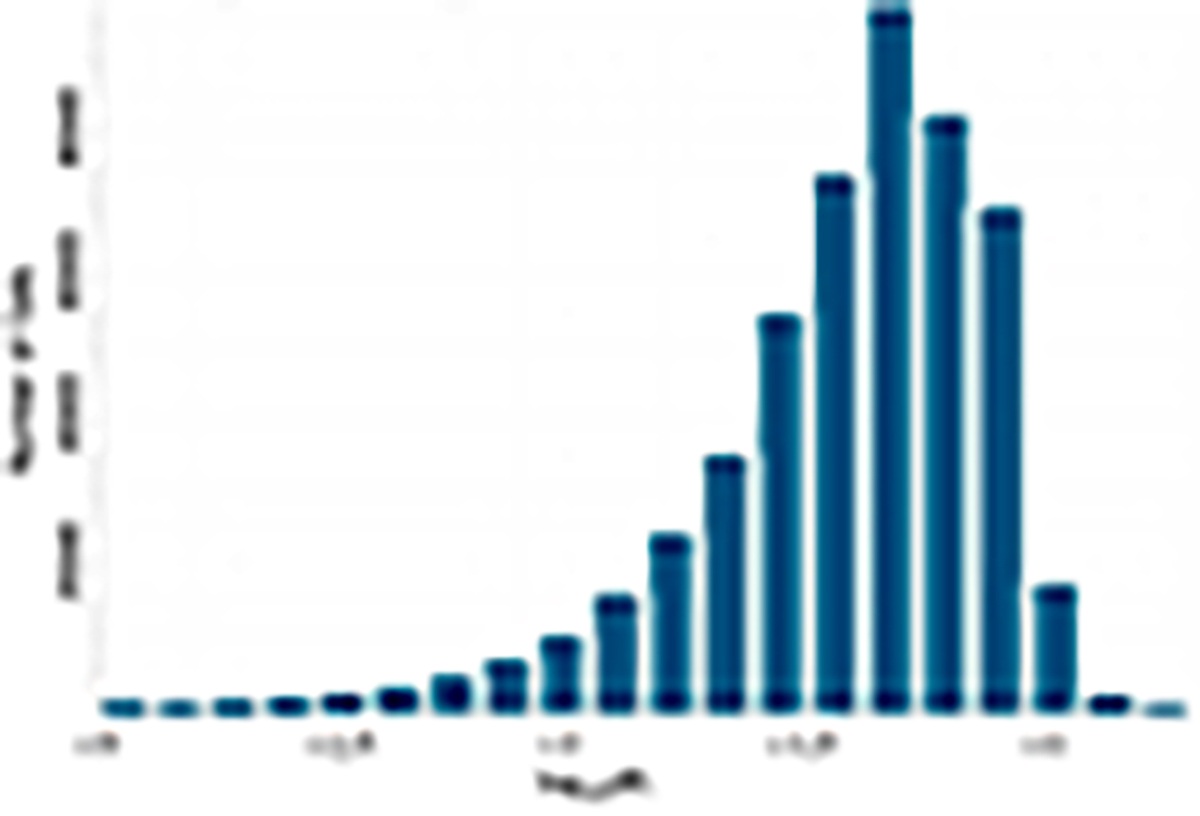
Histogram of magnetic field strength distribution in the flaring region. The magnetic field is in code units. We measured the magnetic field strength at the high electron temperature (Θe > 10) and high density (ρ > 0.001) region at t = 12 240 M of the turbulence heating model of case M20a3D.
Current usage metrics show cumulative count of Article Views (full-text article views including HTML views, PDF and ePub downloads, according to the available data) and Abstracts Views on Vision4Press platform.
Data correspond to usage on the plateform after 2015. The current usage metrics is available 48-96 hours after online publication and is updated daily on week days.
Initial download of the metrics may take a while.