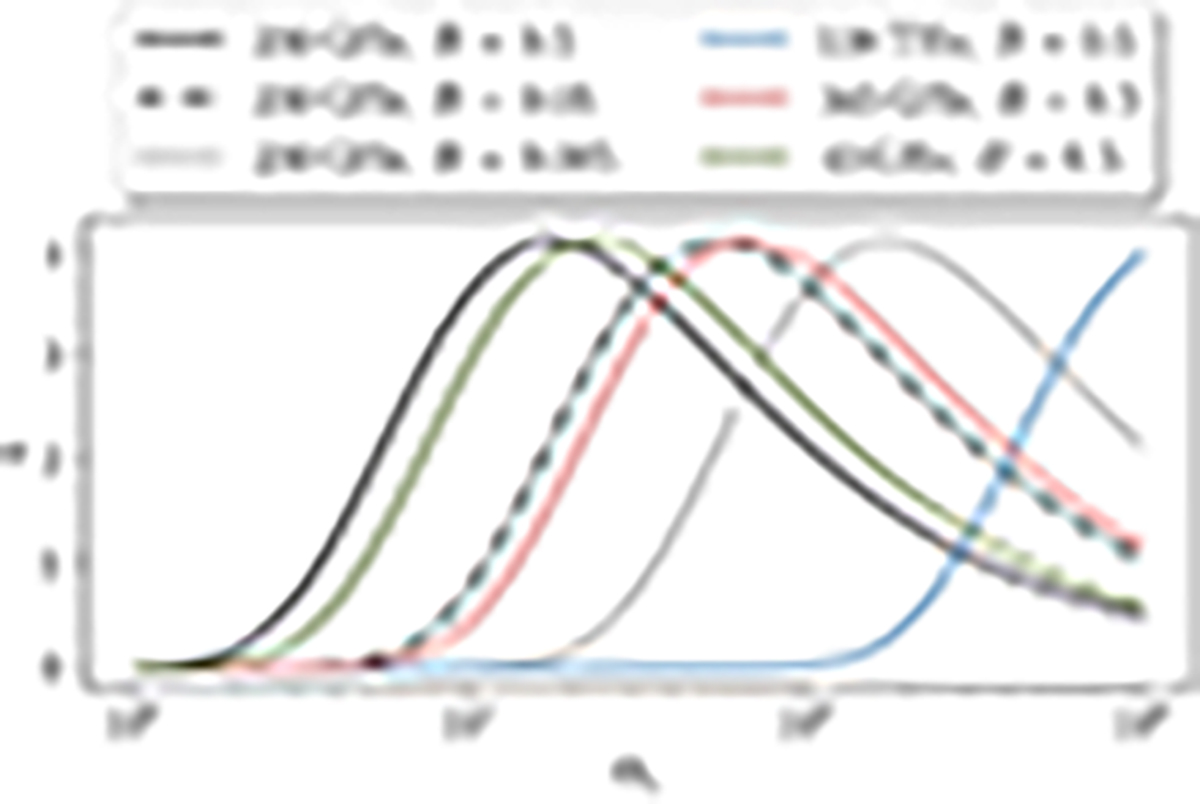
Fig. 11.
Download original image
Distribution of emissivity coefficient η as a function of electron temperature. Solid lines represent the frequency of 230 GHz with different local magnetic field strengths. The purple dash-dotted, red dashed, and dotted lines represent the emissivity coefficient of the 46 GHz, 86 GHz, and NIR frequencies, respectively, with typical magnetic fields in flux rope (B = 0.05).
Current usage metrics show cumulative count of Article Views (full-text article views including HTML views, PDF and ePub downloads, according to the available data) and Abstracts Views on Vision4Press platform.
Data correspond to usage on the plateform after 2015. The current usage metrics is available 48-96 hours after online publication and is updated daily on week days.
Initial download of the metrics may take a while.