Fig. 8
Download original image
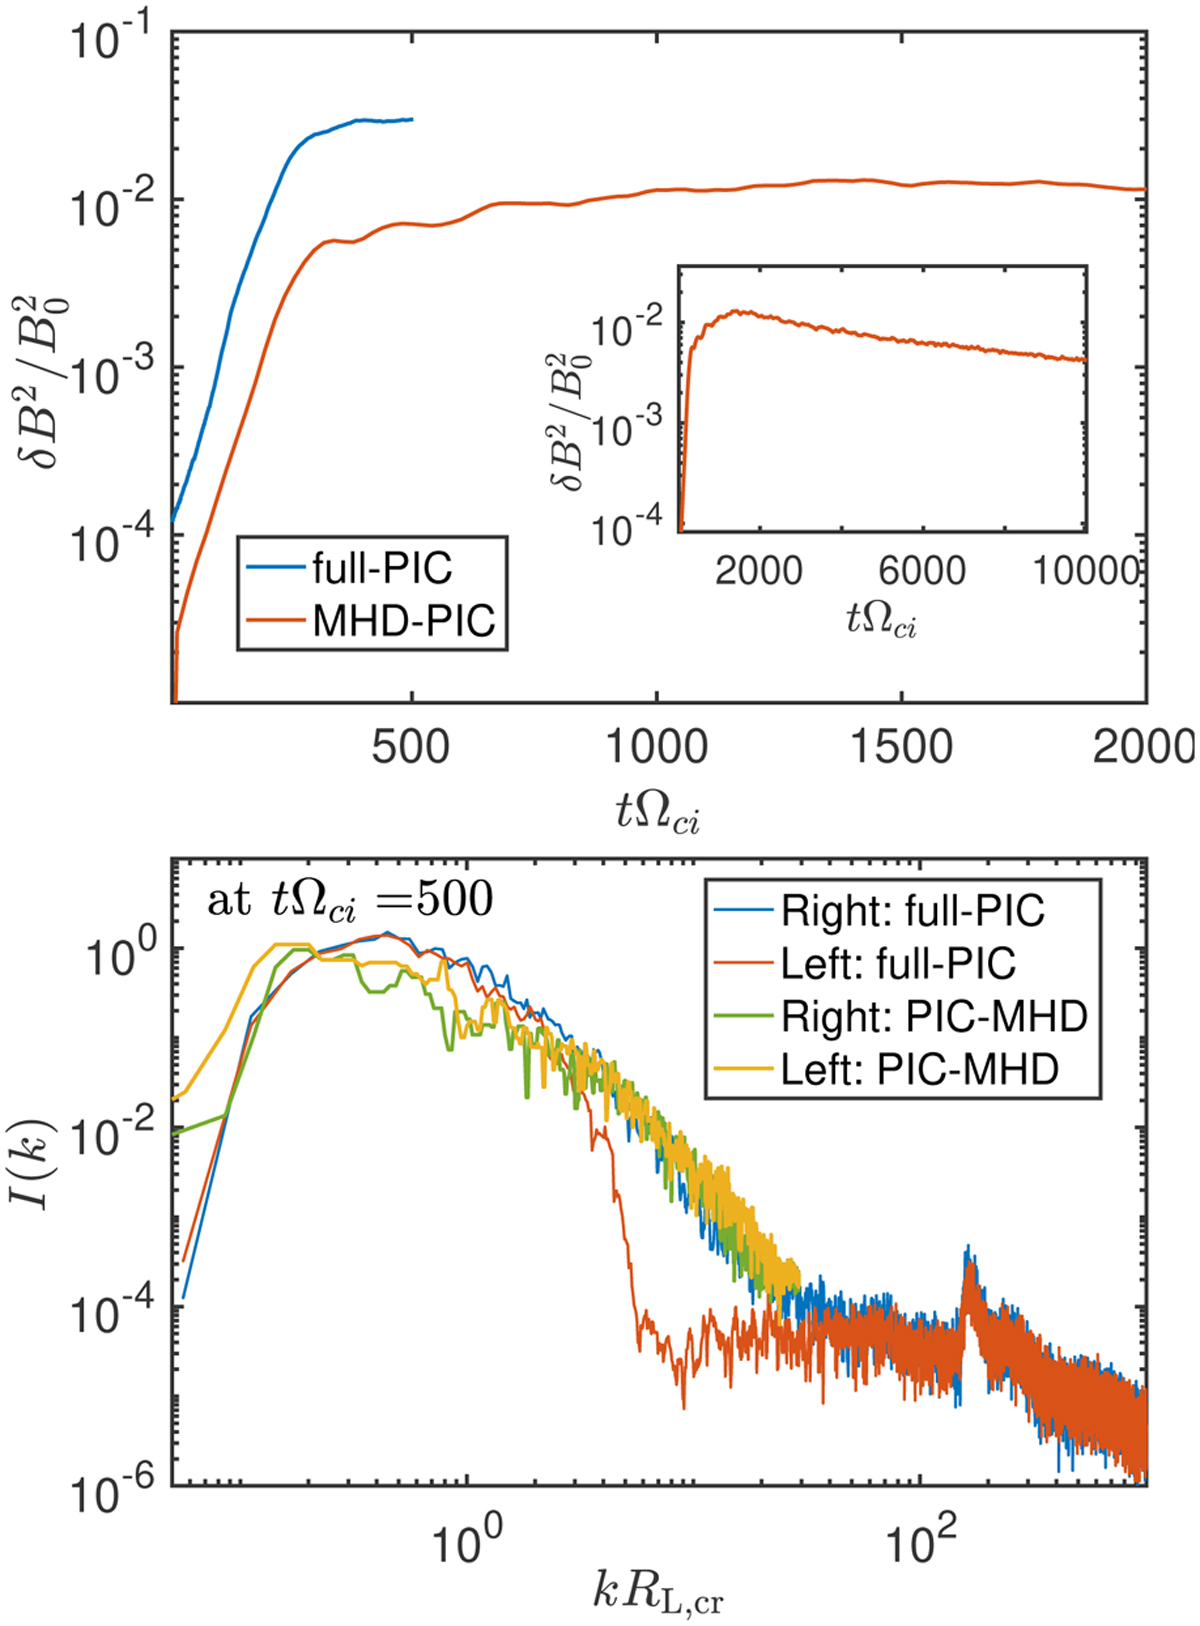
Comparison of the results from full-PIC and MHD-PIC simulations using identical parameters as in run PIC-3 given in Table 2. The top panel presents the average magnetic energy evolution in time for full-PIC (blue solid line) and MHD-PIC (red solid line) techniques. The inset shows the full time-evolution from MHD-PIC simulation, as it runs over a much longer timescale than any full-PIC run. The bottom panel shows the comparison of wave spectra at the time that corresponds to the final time of the full-PIC simulation. Blue and red solid lines show the spectra from full-PIC for right- and left-handed modes, respectively. Green and orange solid lines show the same for MHD-PIC simulation. Note: the spectra from MHD-PIC simulation were upshifted by a factor of ≈ 2 in order to get a better visual comparison.
Current usage metrics show cumulative count of Article Views (full-text article views including HTML views, PDF and ePub downloads, according to the available data) and Abstracts Views on Vision4Press platform.
Data correspond to usage on the plateform after 2015. The current usage metrics is available 48-96 hours after online publication and is updated daily on week days.
Initial download of the metrics may take a while.