Fig. 7
Download original image
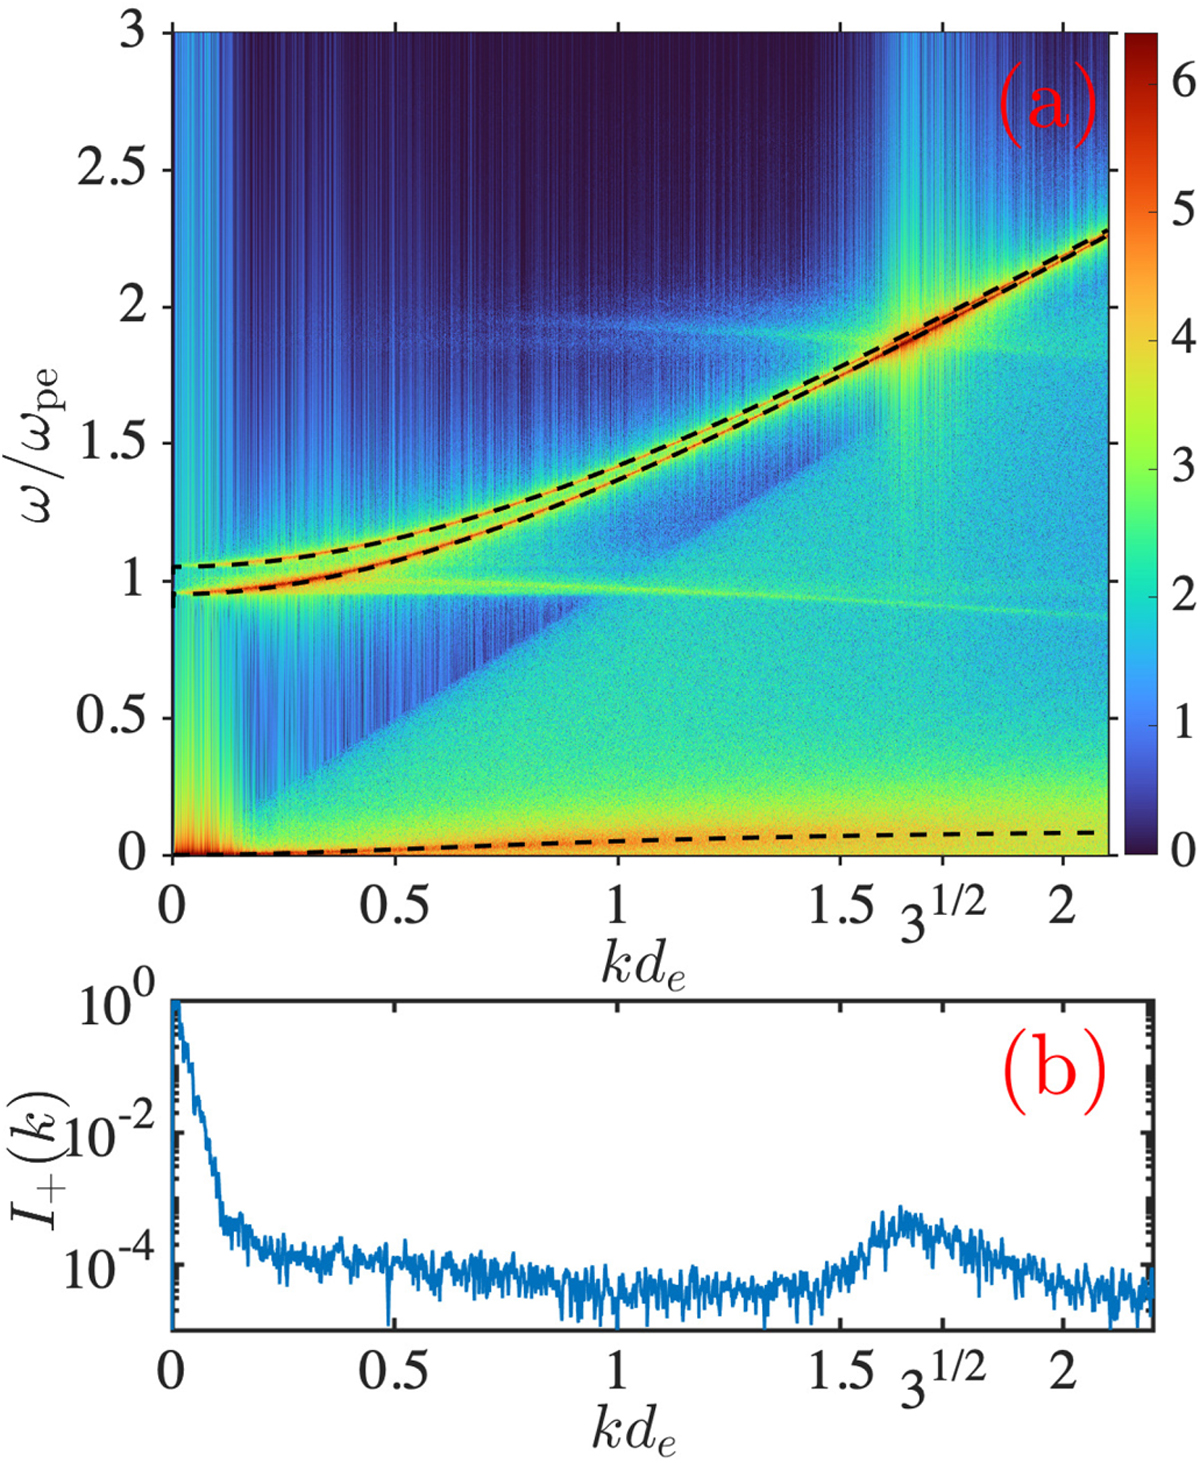
Wave dispersion analysis. Top panel a: wave dispersion ω(k)/ωpe at the final times of the linear phase. From figure simulation (see Table 2 for parameters). The diagnostic was performed on the δBz component between tΩci = 95 ant tΩci = 96.6 (at the end of the linear phase of the instability). Electromagnetic light-wave branch with left and right-handed polarisation is easily identifiable. At low ω < Ωce the Whistler branch is clearly seen as well (theoretical dispersion line over plotted with dashed line). Plasma emission at ω = ωpe is observed and the second harmonic can be observed as well, especially in the brighter zone where it intersects the EM wave. Bottom panel b: I+(k) spectrum at saturation from Fid simulation. It is the same spectrum as in Fig. 5 but plotted using linear x-axis scale and wavenumber plotted in units of ![]() . This improves the visibility of the high-k part of the spectrum.
. This improves the visibility of the high-k part of the spectrum.
Current usage metrics show cumulative count of Article Views (full-text article views including HTML views, PDF and ePub downloads, according to the available data) and Abstracts Views on Vision4Press platform.
Data correspond to usage on the plateform after 2015. The current usage metrics is available 48-96 hours after online publication and is updated daily on week days.
Initial download of the metrics may take a while.