Fig. 6
Download original image
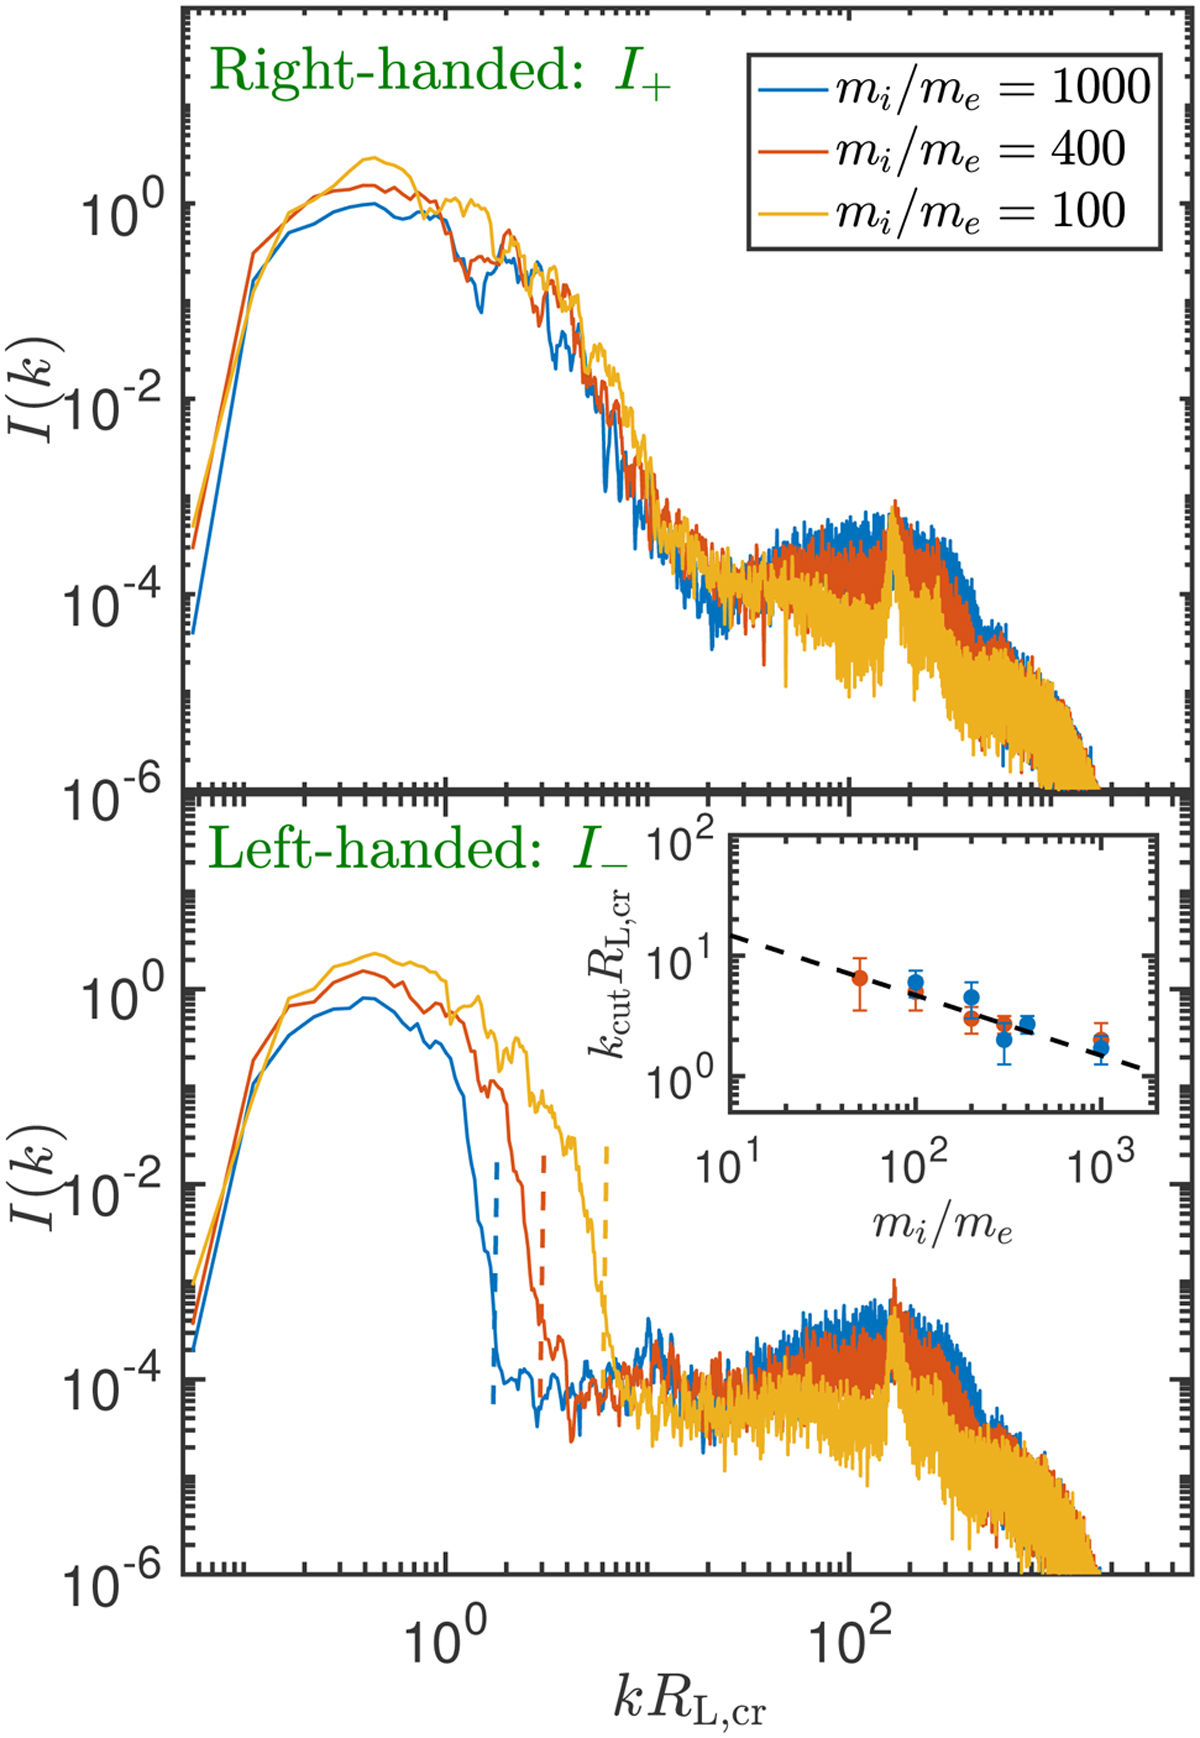
Saturated spectra of right-handed waves (I+; top panel) and of left-handed waves (I−; bottom panel). Lines of different colour correspond to different mass ratio adopted in the simulations: blue line corresponds to mi/me = 1000 (Fid run), red line corresponds to 400, and orange line corresponds to 100. Inset: cut-off wavenumber of left-handed branch for different values of mi/me. Blue circles correspond to values derived from simulations with ncr/ni = 10−2 and red circles are from simulations with ncr/ni = 5 × 10⁻³. The dashed black line follows kcutdi = 0.5.
Current usage metrics show cumulative count of Article Views (full-text article views including HTML views, PDF and ePub downloads, according to the available data) and Abstracts Views on Vision4Press platform.
Data correspond to usage on the plateform after 2015. The current usage metrics is available 48-96 hours after online publication and is updated daily on week days.
Initial download of the metrics may take a while.