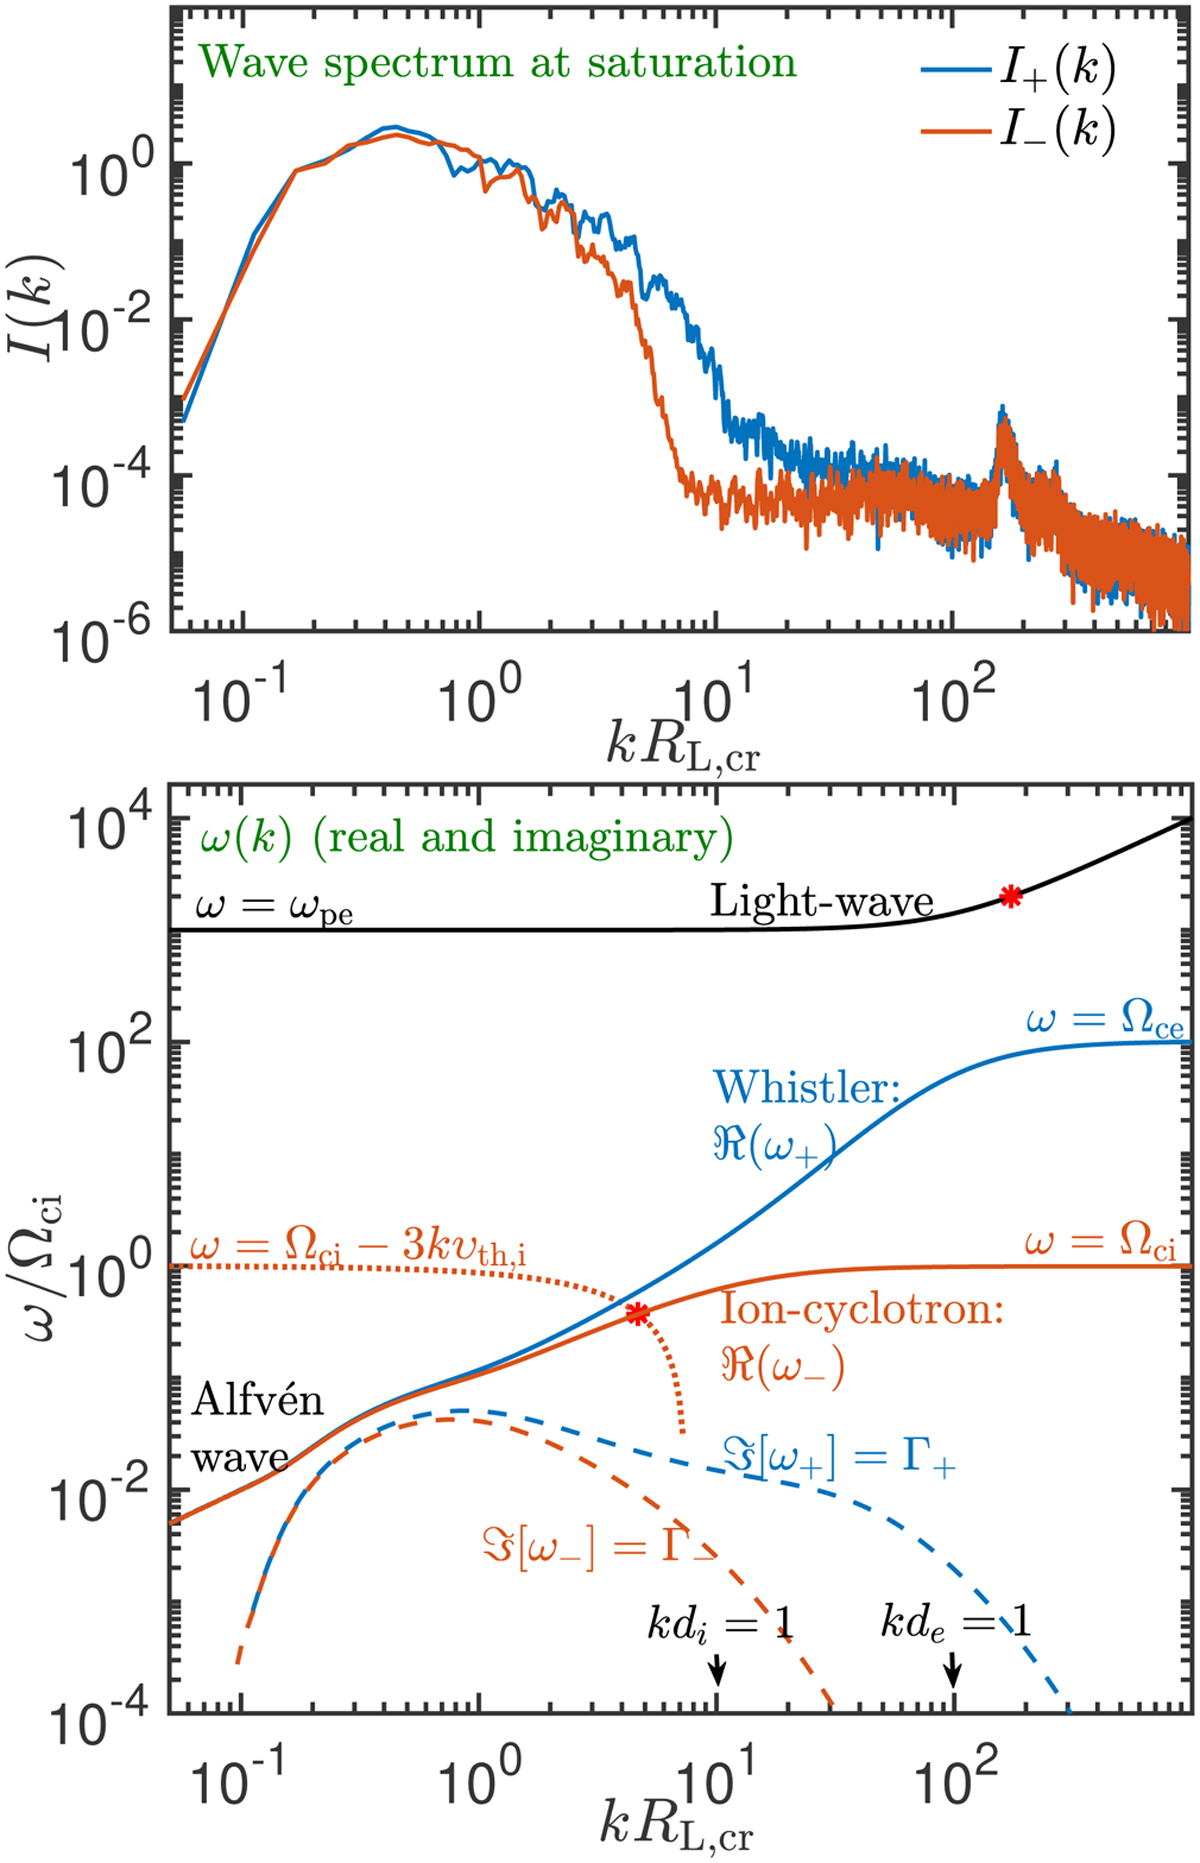
Fig. 5
Download original image
Wave spectrum at saturation and corresponding plasma wave-modes. Top panel: wave spectra in Fid simulation. The blue line for right-handed waves and red line for left-handed waves. Bottom panel: analytic dispersion relation of waves obtained by solving Eq. (16). The real part of ω (solid lines) and instability growth rate for the two polarizations that is the imaginary part of ω (dashed lines). The light-wave is shown with black solid line. The red star symbol at the top left side locates the intersection with ω = 2ωpe line. Alfvén wave corresponds to low frequency and low-k part of red and blue solid lines. At kRL,cr 1 the two branches separate into Whistler (blue solid line) and ion-cyclotron (red solid line). Vertical arrows in bottom panel locate the transition into ion-cyclotron regime (at kdi = 1) for left-handed waves, and electron-cyclotron regime kde = 1 for right-handed waves. The lower red star symbol locates the intersection between the ion-cyclotron branch (red solid line) and Ωce – 3kυth,i (red dotted line).
Current usage metrics show cumulative count of Article Views (full-text article views including HTML views, PDF and ePub downloads, according to the available data) and Abstracts Views on Vision4Press platform.
Data correspond to usage on the plateform after 2015. The current usage metrics is available 48-96 hours after online publication and is updated daily on week days.
Initial download of the metrics may take a while.