Fig. 4
Download original image
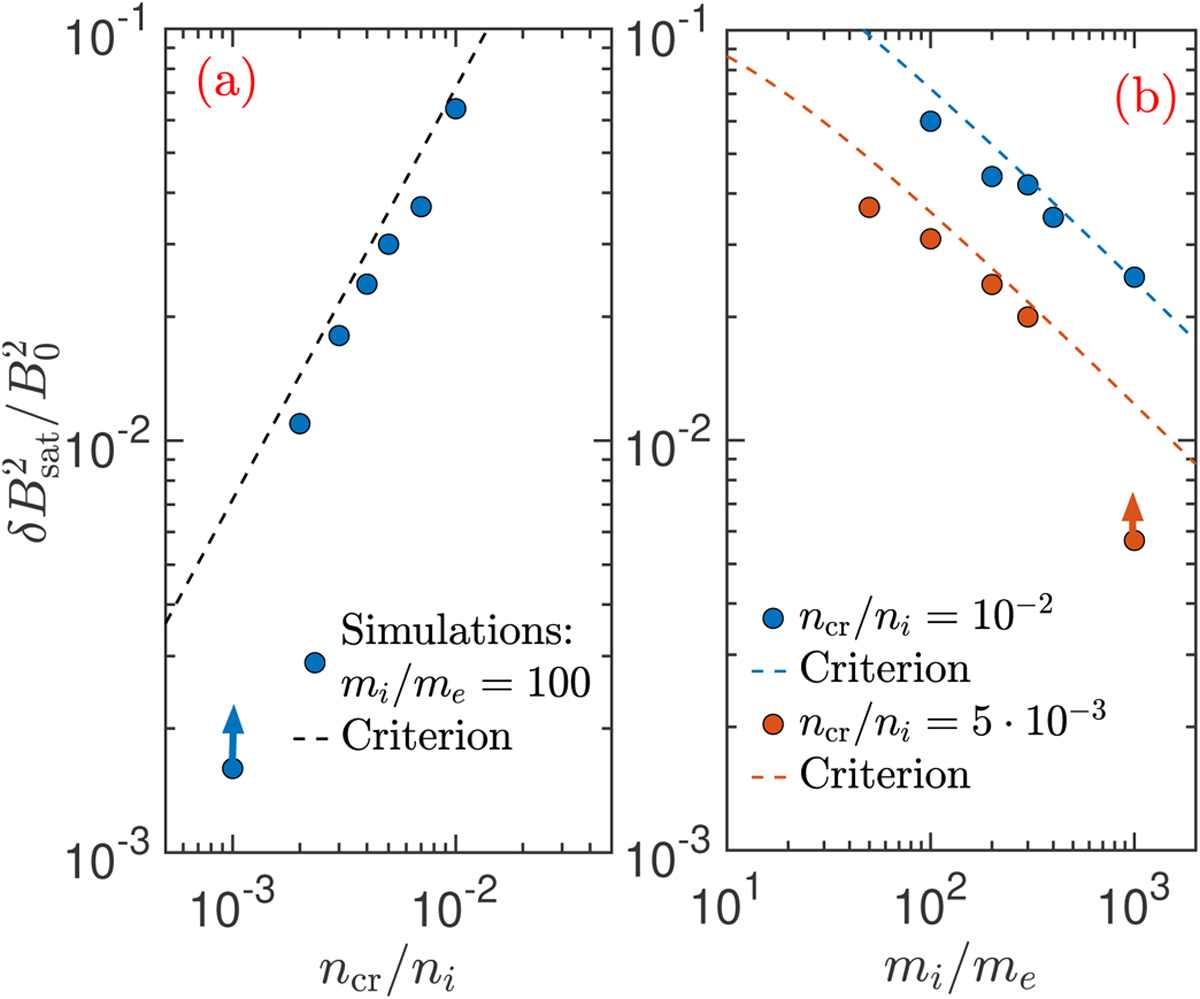
Saturation level of the magnetic fluctuations. Panel a: wave saturation intensity as function of ncr/ni. Blue circles present the results from 1D3V PIC simulations. The red dashed line follows the scaling from Eq. (17) that balances the momentum loss by CRs with momentum gained by waves. The data point at ncr/ni = 10−3 is a lower limit as the simulation ended before a saturated state was reached. Panel b: same but varying mi/me at fixed ncr/ni = 10−2 (blue symbols) and ncr/ni = 5 × 10⁻³ (red symbols).
Current usage metrics show cumulative count of Article Views (full-text article views including HTML views, PDF and ePub downloads, according to the available data) and Abstracts Views on Vision4Press platform.
Data correspond to usage on the plateform after 2015. The current usage metrics is available 48-96 hours after online publication and is updated daily on week days.
Initial download of the metrics may take a while.