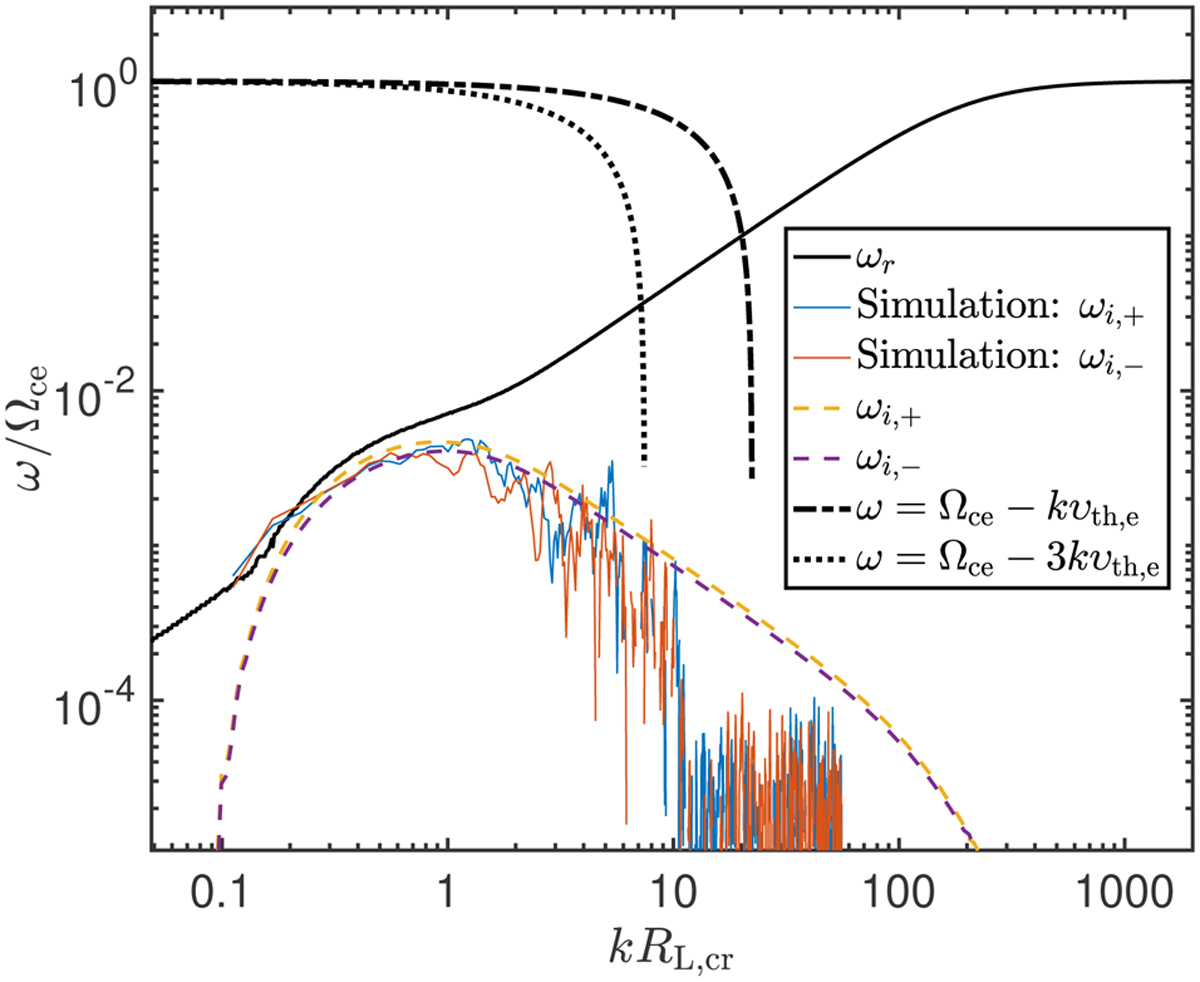
Fig. A.3
Download original image
Real (black solid line) and imaginary part (dashed lines) of the dispersion relation obtained by solving Equation (16), in the case where the background is pair plasma. The growth rates from the corresponding simulation are plotted using blue and red solid lines for right- and left-handed modes), respectively. The fit was not performed on kRL,cr > 50 modes as being strongly affected by thermal noise. The black dot-dashed and dotted lines correspond to Doppler-shifted cyclotron resonance of background thermal plasma: ω = Ωce − kυth,e and ω = Ωce − 3kυth,e, respectively.
Current usage metrics show cumulative count of Article Views (full-text article views including HTML views, PDF and ePub downloads, according to the available data) and Abstracts Views on Vision4Press platform.
Data correspond to usage on the plateform after 2015. The current usage metrics is available 48-96 hours after online publication and is updated daily on week days.
Initial download of the metrics may take a while.