Open Access
Fig. A.2
Download original image
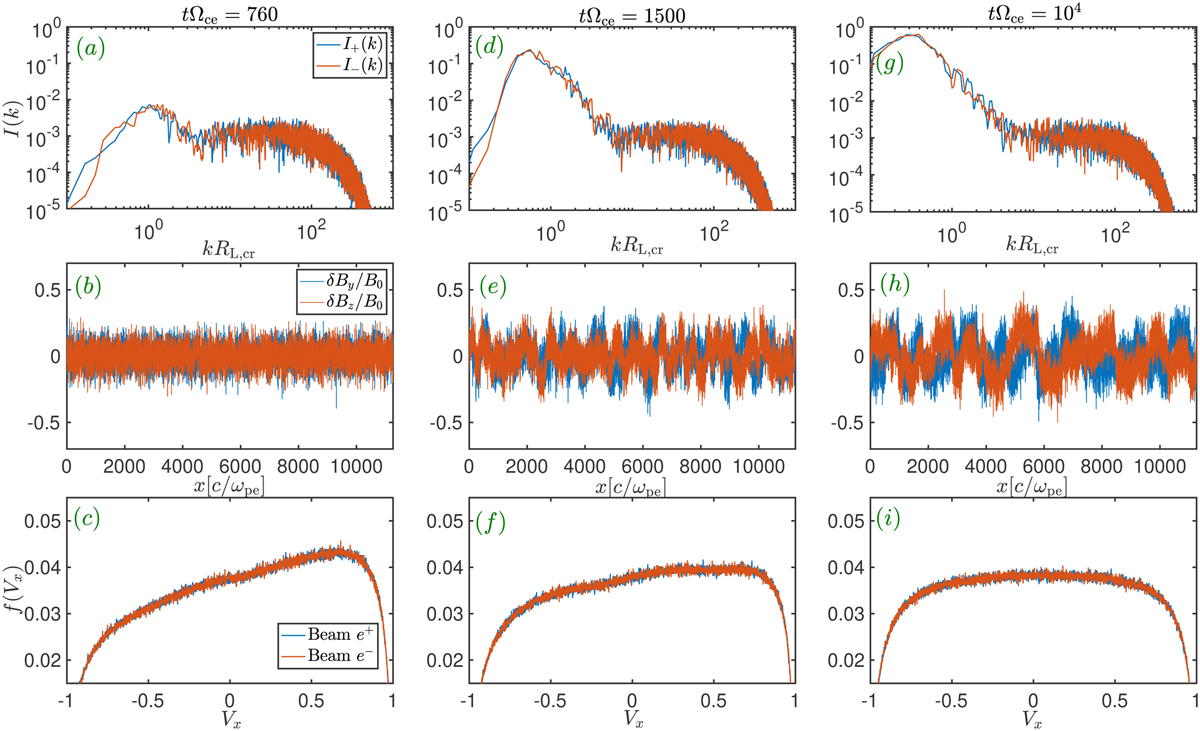
Wave spectrum I(k) (top panels), magnetic field spatial profile (middle panels) and distribution function of beam electrons and positrons f(Vx) and different times of the simulation. Left column corresponds to early time, middle column to the linear phase and right column to the saturated phase of the instability.
Current usage metrics show cumulative count of Article Views (full-text article views including HTML views, PDF and ePub downloads, according to the available data) and Abstracts Views on Vision4Press platform.
Data correspond to usage on the plateform after 2015. The current usage metrics is available 48-96 hours after online publication and is updated daily on week days.
Initial download of the metrics may take a while.