Open Access
Fig. A.1
Download original image
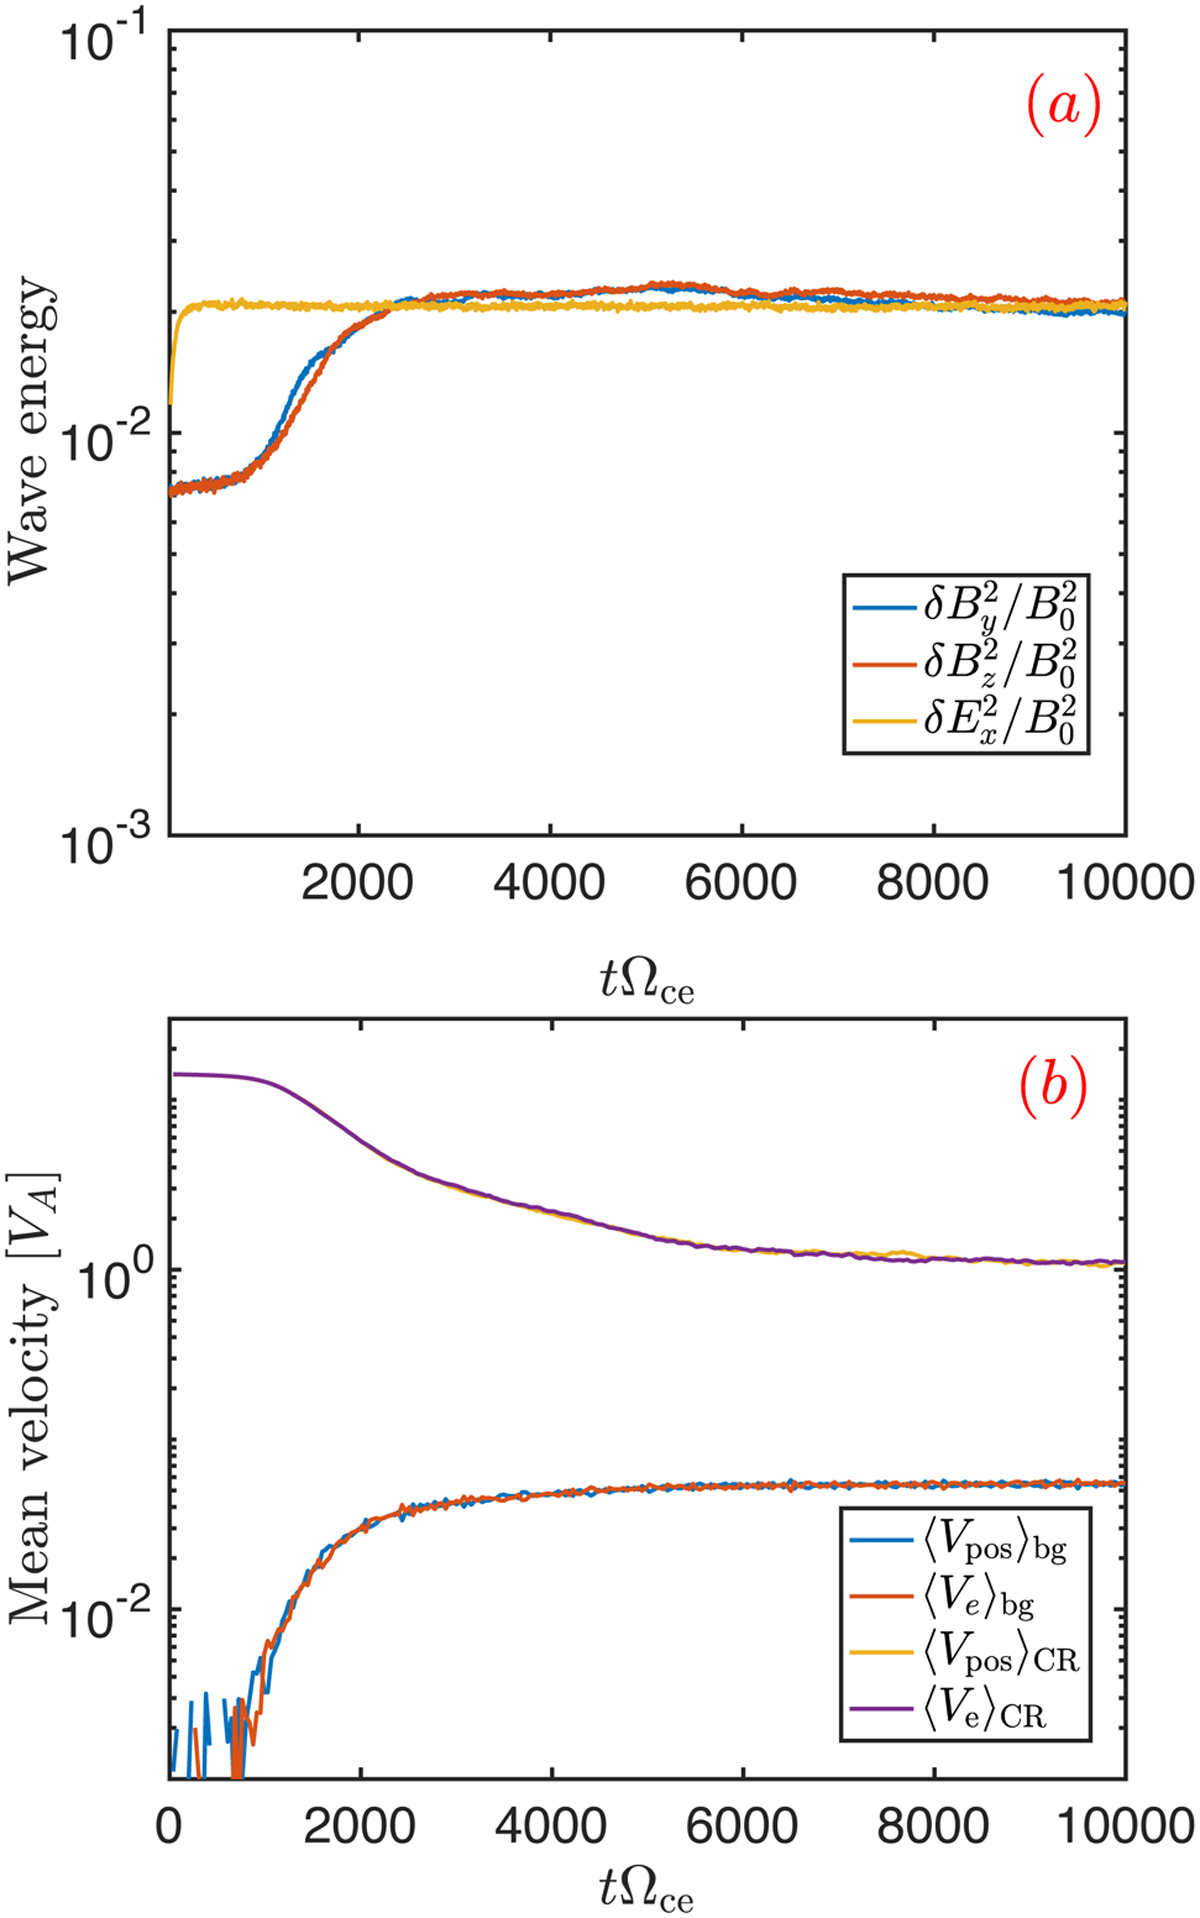
Same as Figure 1 but for the simulation with electron–positron background mi = me; run PIC-17. Overall time evolution of field intensities (panel a) and drift velocities of different populations (panel b).
Current usage metrics show cumulative count of Article Views (full-text article views including HTML views, PDF and ePub downloads, according to the available data) and Abstracts Views on Vision4Press platform.
Data correspond to usage on the plateform after 2015. The current usage metrics is available 48-96 hours after online publication and is updated daily on week days.
Initial download of the metrics may take a while.